Credit card facts and statistics: 2023

We’ve collated the latest credit card statistics for 2023 including data on users, usage, transactions, providers, credit scores, crime, and more. Here's what we found.

Credit cards are a flexible way of borrowing money in order to pay for various products and services. For many, they have become essential to the modern economy, with many relying on credit cards in day-to-day life.
Let’s look into some credit card credit card statistics and facts surrounding credit card use in the UK, consumer spending habits, credit scores, fraud, and more from 2023.
If you need a new card for your business ventures ensure you compare credit cards to get the best deal.
On this page, we’ll cover:
UK credit card statistics
UK credit card users statistics
Credit card usage statistics
UK credit card transaction statistics
Credit card vs cash statistics
Breakdown of different credit cards
Credit card network statistics
Most popular credit cards statistics
UK credit score statistics
UK credit card debt statistics
Credit card crime statistics (including fraud and theft)
Top 10 UK credit card statistics 2023:
Around 33.8 million (64%) adults in the UK have at least one credit card.
Consumers borrowed £1.2 billion in net consumer credit in July 2023.
Credit card issuance generated around £13.8 billion in UK revenue in 2022.
There were 362 million credit card transactions in June 2023.
The average credit card balance in the UK is £1,675, as of May 2023.
78% of UK adults have at least one form of consumer credit.
Individuals collectively borrowed a net £0.6 billion on credit cards, in July 2022.
21.6 million in the UK used cash either once a month or not all, in 2022.
Between June 2022 and June 2023, total outstanding credit card balances in the UK increased by £12.1 billion.
UK credit card debt reached £66.4 billion in June 2023 – up around 8% from 2022.
UK credit card statistics
In May 2022, 44 million UK adults (83% of the total population) used some form of credit or loan product. This is an increase of 11% from 2017 when the total sat at 39.6 million (78%), but a decline of less than 1% from 2020 when the number was 44.4 million (85%).
More than three-quarters (78%) of adults in the UK have at least one form of consumer credit (i.e. credit cards that are paid off each month) – down from 80% in 2020.
Conversely, less than a fifth (17%) of UK adults do not access credit, either through choice or personal circumstances.
In the UK, 64% of adults (33.8 million) have at least one credit card. This is a decline from 2020 when 66% of adults had a credit card, but an increase from 2017 when the figure stood at 62%.
UK credit card acquisition statistics
According to credit card statistics from the FCA, over half (56%) of UK residents obtain their credit cards online.
A breakdown of how UK residents acquire their credit cards
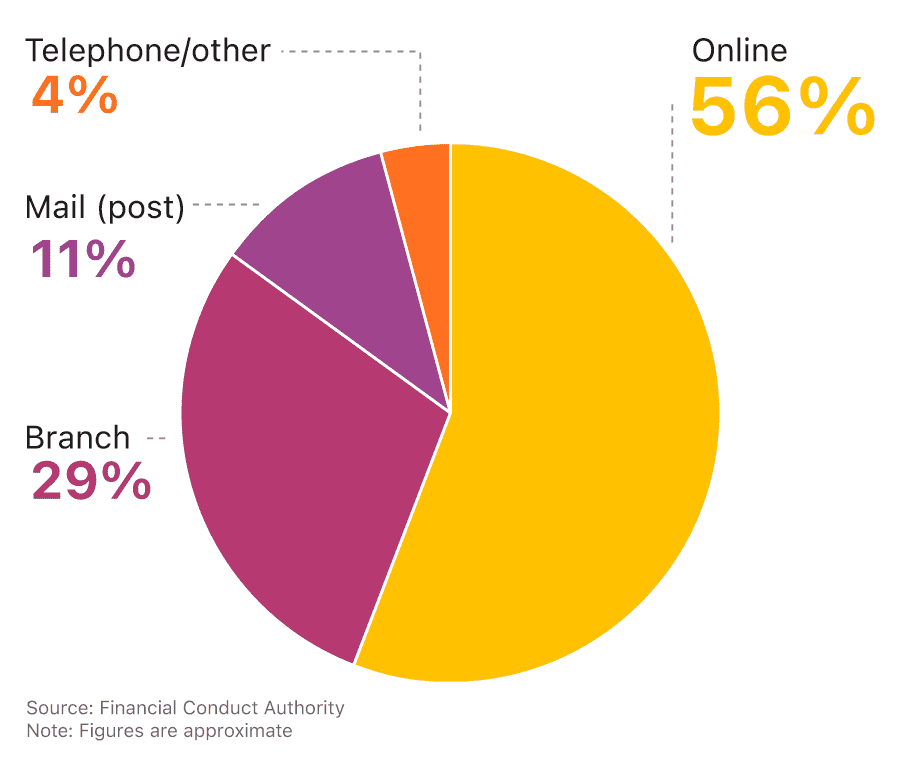
Less than a third of people (29%) will get their credit card by visiting a local branch, with around one in 10 (11%) opting to order one via postal delivery services.
Consumer borrowing and credit card lending statistics
Recent credit card statistics found that, in June 2023, consumers borrowed £1.6 billion in net consumer credit. This was then followed by a further £1.2 billion of borrowing in July 2023, which was significantly higher than the 12-month pandemic average of £1 billion up to February 2020.
Though overall consumer borrowing increased between June and July 2023, credit card borrowing remained unchanged at £0.6 million for the third consecutive month. This represents a significant fall from February 2022, when lending via credit cards reached a record high of £1.5 billion.
The primary reason for the fall in consumer credit borrowing between June and July 2023 was other forms of consumer credit (such as card dealership finance and personal loans), which fell from £1 billion to £0.6 billion.
In 2020, there was a rapid decrease in gross credit card lending, when figures plummeted by more than a fifth (21%). The following year, annual growth in credit card lending between February 2021 and February 2022 reached 9.4% – a five-year high at the time.
From there, borrowing has continued to climb, with the annual growth in credit card lending for July 2023 standing at 11.7% – down from 11.9% the previous month.
UK credit card market share statistics
Credit card issuance in 2023 is estimated to have generated around £13.8 billion in the UK alone. After a steady increase in revenue between 2013 and 2020, the credit card industry endured a sharp pandemic decline of almost a quarter (24%) between 2020 and 2021.
A breakdown of how the UK credit card market size has changed over time
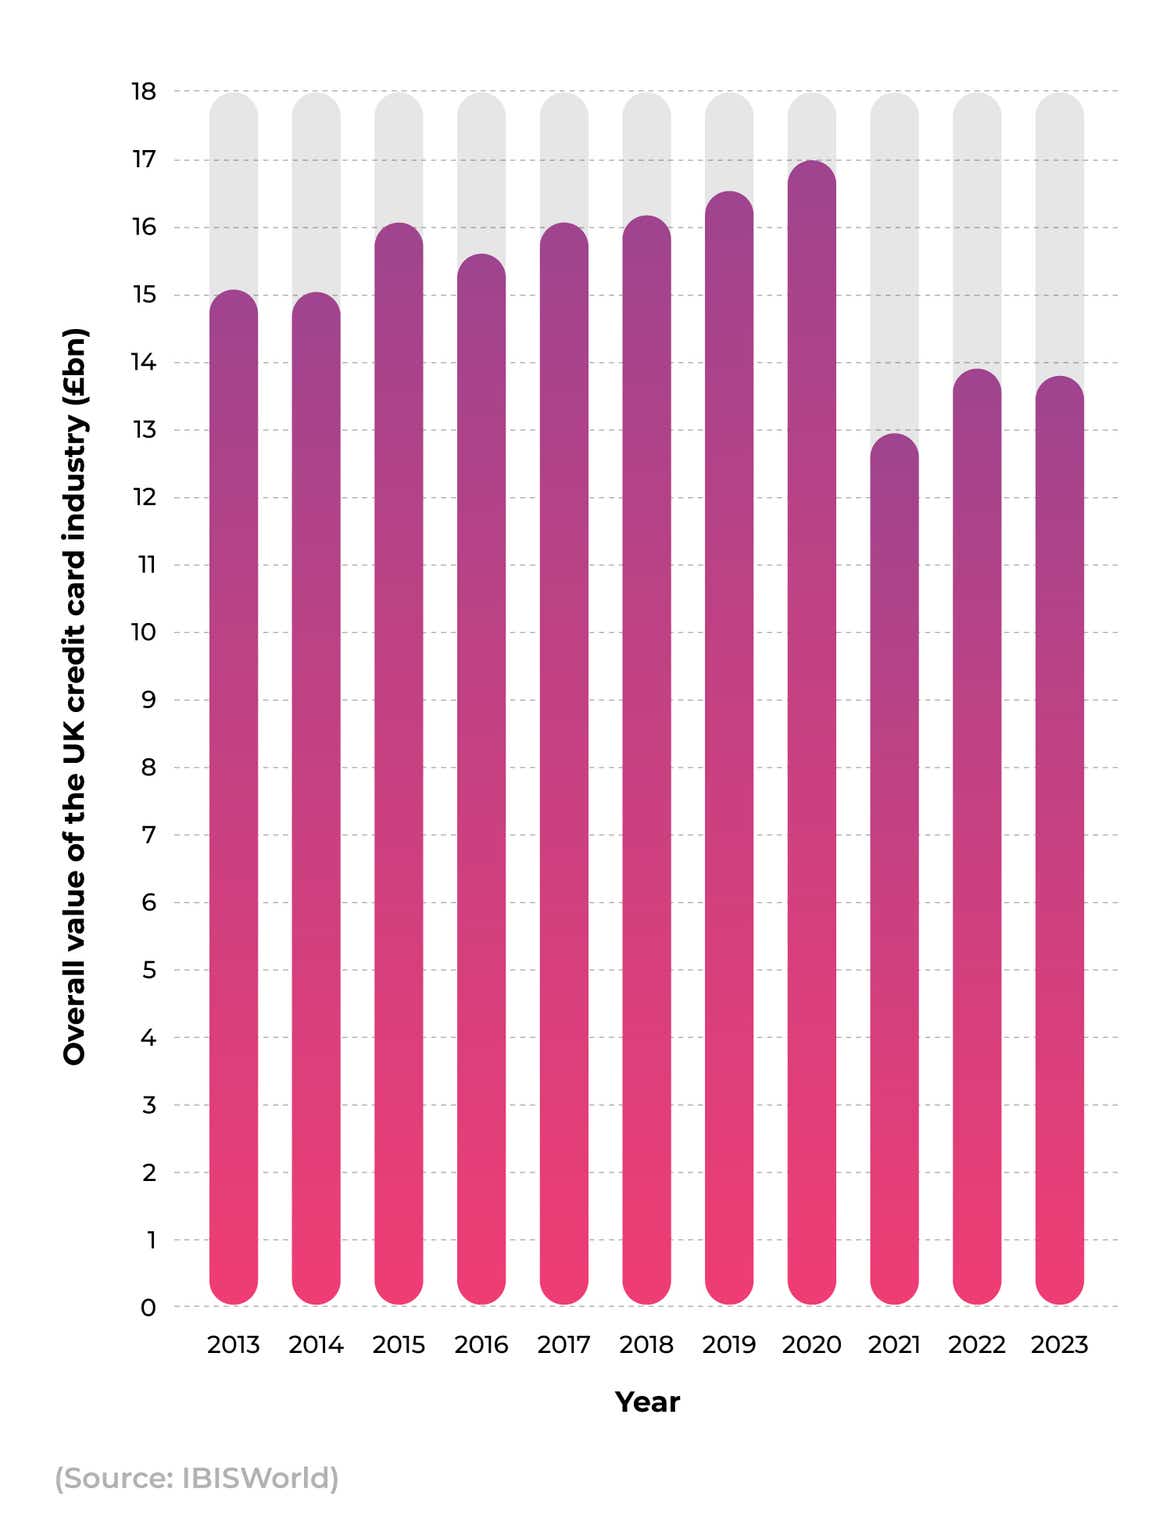
Credit card issuance in 2022 is estimated to have generated around £13.5 billion in the UK alone. Between 2017 and 2022, the market size of the credit card issuance industry declined by 1.6% per year on average, but has increased once again by 4.9% in 2022.
Following an 8% increase between 2021 and 2022, the latest figures of £13.8 billion represent a small annual decline of less than 1%. This means that the market value of the UK credit card industry in 2023 is around 19% lower than the industry peak in 2020.
Most popular credit card statistics
In 2022, Visa was declared the best credit card company in the UK of those assessed by YouGov BrandIndex metrics. YouGov is an international online research data and analytics technology group and its reports measure an organisation's overall ‘brand health’. They take into account different variables to generate a score, including consumers’ perceptions of:
Brand quality
Value for money
Impression
Satisfaction
Reputation
The extent to which they would recommend the brand to others.
With a score of 36.7, this placed Visa ninth in the top 10 of tested brands in the UK across all industries for that year, behind the likes of Netflix (38.9), Marks & Spencer (46.5), Cadbury (40), and John Lewis (38.8).
Visa was also voted the most popular credit card provider for 2019, with a score of 38.3. It was followed in second place by PayPal (33.8) and Mastercard in third (27.6). Barclaycard came fourth with 15.3 and American Express in fifth with 9.4.
Global credit card market share statistics
The global credit card market has seen sustained growth over time, from over $100 billion in 2020 to $103 billion in 2021, at a Compound Annual Growth Rate (CAGR) of 3%.
The latest report from Custom Market Insights valued the industry at $USD152.2 billion in 2022, with the overall value expected to reach $USD 165.6 billion by the end of 2023 and $USD 286.5 billion by 2032. If these projections prove correct, it would mean that the industry value will increase by a Compound Annual Growth Rate (CAGR) of 9.1% over this period.
UK credit card user statistics
As of June 2023, there were 58 million resident credit cards in circulation across the UK – 54 million of which were contactless.
Over the previous decade, the number of credit card users in the UK has steadily increased. In 2010, UK credit card penetration (the share of the total population who use a credit card) stood at 40%. By 2015, this had risen to 50%, and by 2020, to 62%. By 2025, it is expected to reach 71%.
In terms of numbers, approximately 35% of payment cards issued between 2000 and 2020 in the UK were credit cards.
In 2019 the number of credit cards in the UK exceeded 60 million for the first time, with an average of 1.7 per person. However, since then, numbers have declined.
As of October 2021, there were approximately 52.97 million credit card accounts in the UK, with almost two-thirds of these (34.79 million) being active (those with balances outstanding at the end of the calendar month). Given that the UK population in 2021 was about 67.2 million, this equates to almost 1.3 cards per UK resident.
These figures have increased steadily since, with 58 million resident credit card accounts in the UK as of June 2023. Of these, 36 million (60%) were active.
Debit card vs credit card usage statistics
By comparison, debit cards are almost twice as common in the UK, compared to credit cards, for both the number of transactions and the value spent.
Between July 2022 and June 2023, the number of UK credit cards remained consistently around the 60 million mark whereas the number of UK debit cards has been pushing 100 million throughout the same period.
In 2020, debit card penetration reached 1.8 cards per person, with around 99.3 million in existence, as of May 2021. This increased to 100.4 million debit cards in July 2023, of which almost 92% (93.4 million) were contactless.
According to recent credit card statistics, the number of credit cards in the UK is projected to reach 63.64 million by 2025, while the number of debit cards is forecast to exceed 108.6 million.
A breakdown of credit and debit card transactions and value spent between 2022 and 2023
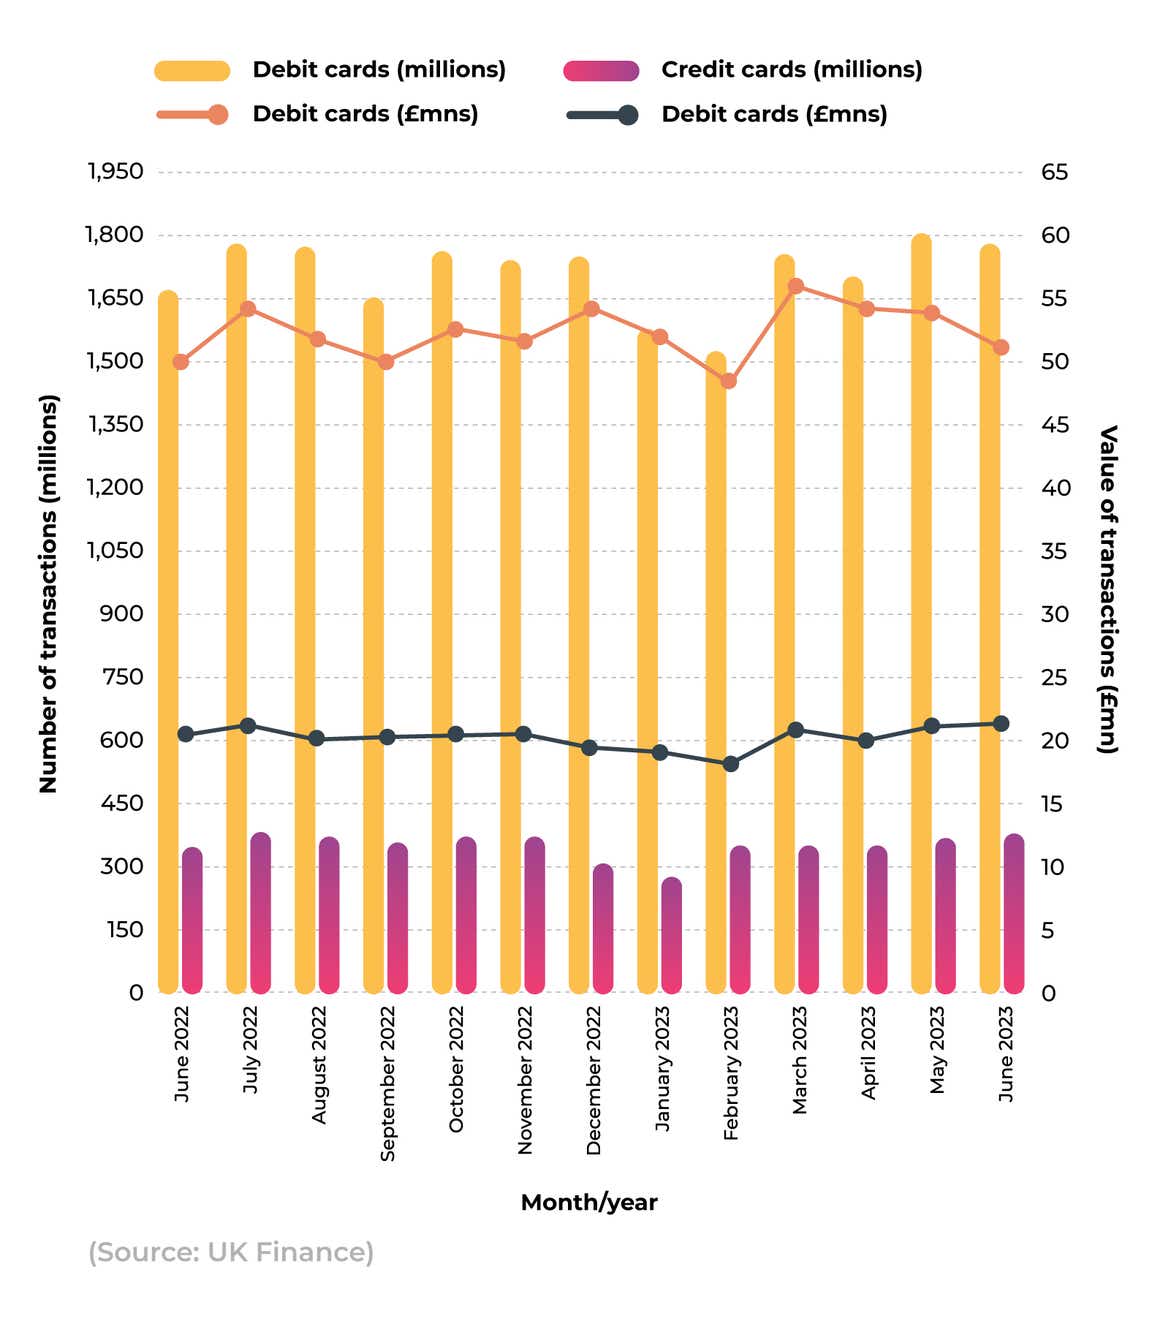
UK debit card spending remained steady between June 2022 and June 2023, with around £54.3 billion spent in July 2022, including transactions from overseas-issued credit cards in the UK. Debit card spending then fell, reaching a low of £48.3 billion in February 2023.
Since then, there has been a largely upwards climb, peaking at £56.6 billion in March 2023 before slipping back slightly to £53 billion in June 2023. However, this still represents a 4.3% increase over the monthly debit card spend recorded for June 2022.
Similarly, monthly credit card spending fluctuated over this period, with figures between £18-21.5 billion. In February 2023, spending dropped to £18 billion, before stabilising. A peak of £21.5 billion was reached in June 2023, representing an increase of 5.9% from the previous year.
A breakdown of the average credit and debit card spend in the UK over time
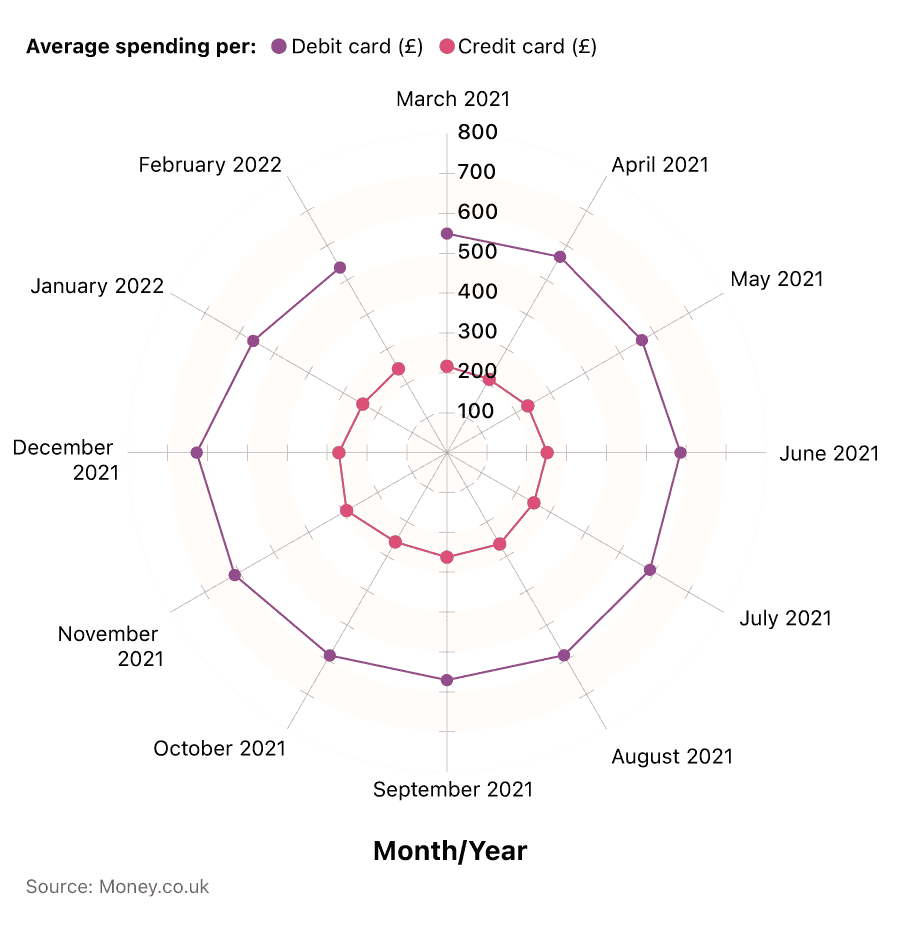
In terms of average spend, people spend more than twice the amount on debit cards as they do on credit cards.
Throughout March 2021 and February 2022, this has stayed relatively stable for both, reaching a peak of £627 for debit cards in December 2021 and £291 for credit cards in November 2021. Conversely, the average debit card spend dipped in March 2021 to £550, and in April 2021 to £212 for credit cards.
Credit card ownership statistics by country
Compared to the global picture, there are 2.8 billion credit cards in use worldwide, with 1.06 billion in the US.
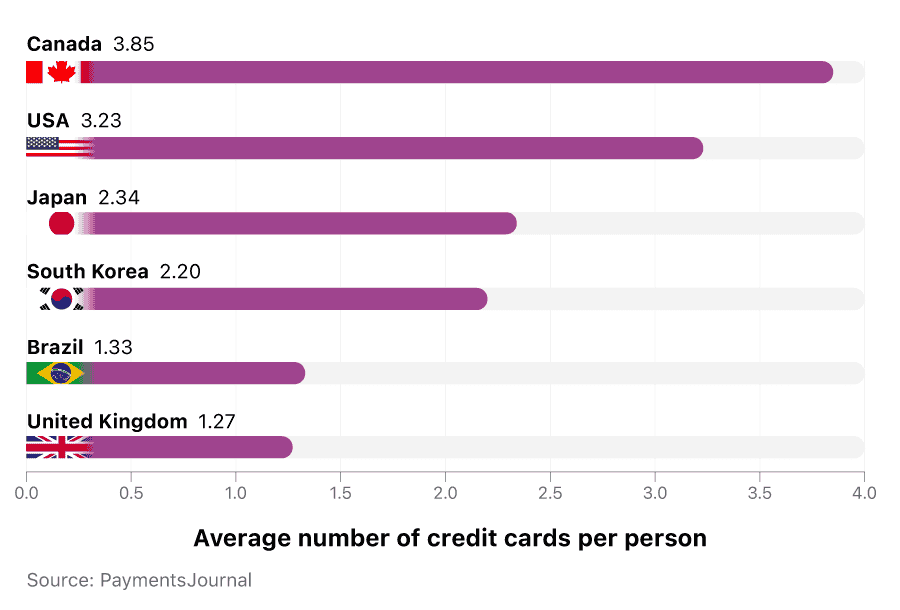
In terms of credit cards per person, the UK ranks sixth, with 1.27. Comparatively, Japan has almost twice as many credit cards per person (2.34), while Canada has three times as many (3.85).
A comparison of the average number of credit cards per person across different countries
Types of card users
According to an Experian survey, 82% of credit card users fit into one of the following nine categories:
Inactive users
Infrequent users
Transactors
Users with recent promotional balances
Users with promotional balances
Users with promotional balance rollover
Infrequent revolvers
Revolvers
Hardcore revolvers
A breakdown of the different types of UK card users, what proportion of the credit card population they make up, and their respective average credit card scores
| Group | Proportion | Average score |
|---|---|---|
| Inactive users | 6.06% | 1,033 |
| Infrequent users | 3.14% | 1,054 |
| Transactors | 8.50% | 1,027 |
| Users with recent promotional balance | 1.89% | 982 |
| Users with promotional balance | 9.41% | 932 |
| Users with promotional balance - roll over | 1.94% | 852 |
| Infrequent revolvers | 8.49% | 983 |
| Revolvers | 11.10% | 895 |
| Hardcore revolvers | 31.50% | 803 |
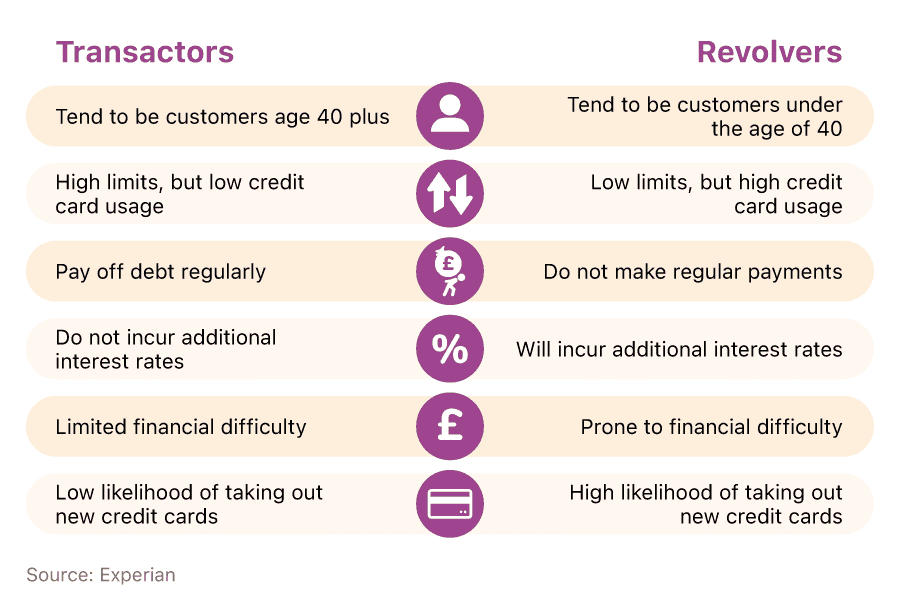
Transactors, which make up 8.5%, will pay their statement balance in full every month and generally have one of the better average scores on Experian’s aggregated bureau index.
Representing over 11% of users, revolvers do not pay their outstanding balance in full every month and will incur a resulting rate of interest on their credit card debt. As a result, their bureau index score is severely less, at 895. Hardcore revolvers are the most popular group. At 31.5%, these people only pay the minimum amount each month, which in turn produces the lowest average score of 803 (over 200 points less than transactors).
A comparison of the characteristics for transactor and revolver card users
UK credit card transaction statistics
When broken down, the average amount spent per UK credit card transaction has slowly declined over recent years. From 2018 to 2021, it varied between £51 and £55 per credit card purchase.
Since June 2022, the total value of credit card transactions fluctuated between £19 billion and £21 billion. However, in February 2023, this figure dropped to £17.3 billion, before recovering to £20 billion in March 2023 and climbing to the year’s high in May 2023.
Since then, the total value of credit card purchases has dipped marginally, amounting to £20.7 billion as of June 2023. During this period, the volume of credit card transactions slowly increased, from 343 million in June 2022 to 369 million in June 2023. This represents a year-on-year rise of 7.6%.
Credit card usage statistics
Individuals borrowed a net £626 million on credit cards in July 2023, a fall of 45% from January 2023, when total borrowing was £1.1 billion. These figures remain consistent with the previous two months, which both came in around the £600 million mark.
A breakdown of how UK credit card lending has changed over time
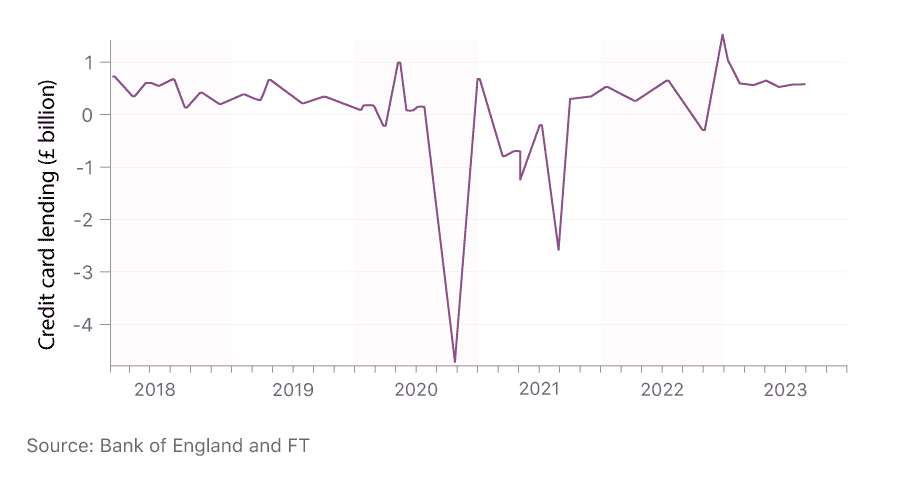
The latest credit card statistics found that there were 1.6 billion contactless card transactions in June 2023 – 10.5% more than in June 2022. Contactless transactions accounted for almost two-thirds (63%) of all credit card transactions, and over three-quarters (76%) of all debit card transactions over this period.
By June 2023, there were 229 million contactless credit card transactions per month – 13.8% higher than the same time the previous year.
What do UK credit card users spend their transactions on?
Between January 2020 and June 2022, the UK population spent more in December than any other month, with the vast majority going on delayable goods and staples.
A breakdown of average monthly UK credit card transactions over time
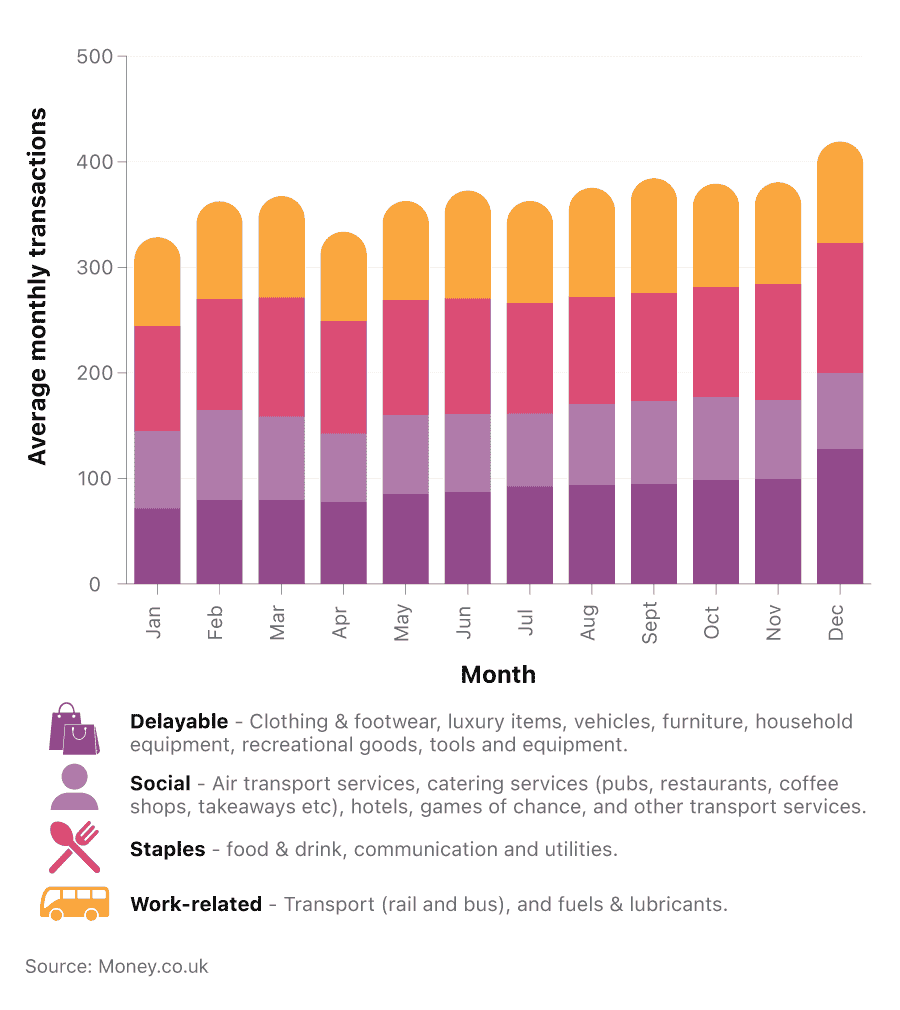
The least amount of money was spent in April, with staples again providing the main source of expenditure. This is the case for virtually every month, except August and September, where more is spent on work-related purchases.
The amount of spending on delayable goods tends to increase throughout the year, starting at an index score of 71.21 in January and rising to 127.6 in December. Social spending tends to fluctuate throughout the year with index scores of around 70, the peak of which is in February (84.95).
Work-related expenditure tends to stay relatively stable throughout the year, with the exception of January, when it drops to an index score of 83.71 and September, when it rises to 108.74.
How have these credit card transaction trends changed over time?
According to a survey from Mintel, 40% of UK cardholders report owning a credit card to make online purchases. This is a 5% increase on 2019 figures, with 37% stating that they tend to use their credit card for larger purchases.
12% were now using credit cards more than usual, to cope with the increased cost of living in the first half of March 2022. This figure rose to 18% for those aged 30-49, and 21% for those who were renting.
A breakdown of UK credit card customers' spending habits for January and February 2022.
Over the last decade, there has been an element of fluctuation in credit card usage in the UK. In 2012, there were 2.02 billion credit card payments across the country, which rose to a peak of 3.57 billion in 2019. However, within the space of a year, this rapidly declined to 2.85 billion.
In the wake of the global COVID-19 pandemic, it is clear that UK consumers are taking significant steps to curb unnecessary spending.
After a steep decline in April 2020, the volume of monthly credit card transactions has since started to increase, reaching around 320 million transactions in October 2021 and 350 million by December 2021. This is nearly 20% more than December 2020, yet only 2% higher than pre-pandemic December 2019. By February 2022, this figure had dropped to around 284 million.
2023 saw a slow rise in credit card transactions once again, with the volume of monthly credit card transactions in June 2023 reaching 368.5 million. This represents an increase of over 7% from June 2022, but remains some distance from pre-pandemic levels.
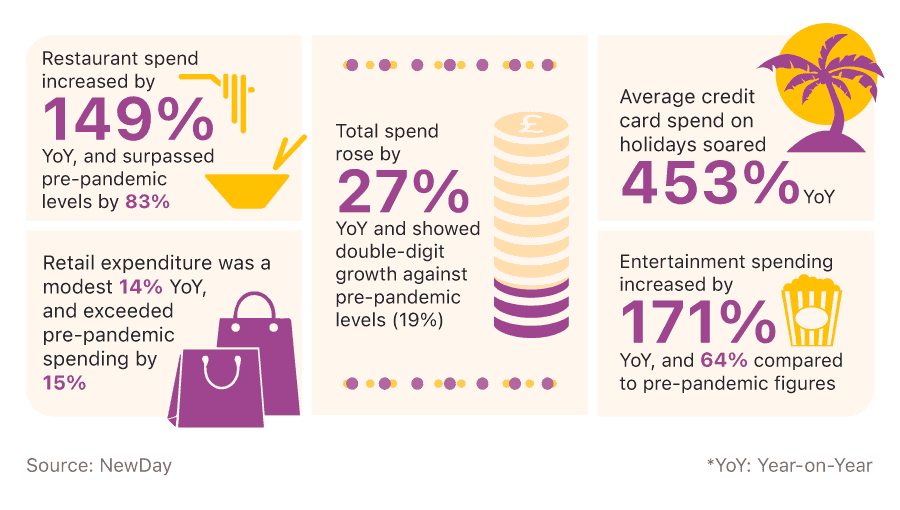
Changes to credit card spending trends between 2022 and 2023
By May 2022, the rising cost of living was having an effect on credit card expenditure in the UK, with the average monthly UK credit card spend at £753. This represented an increase of around 1% over the previous month and almost 16% compared to the previous year.
A breakdown of UK credit card trends between 2022 and 2023
| May 2022 | May 2023 | |
|---|---|---|
| Average UK credit card spend | £753 | £800 |
| Average card balance | £1,555 | £1,675 |
| Percentage of payments to balance | 42.06% | 39.44% |
| Accounts with one missed payment | 1.45% | 1.59% |
| Accounts with two missed payments | 0.24% | 0.30% |
| Accounts with three missed payments | 0.16% | 0.20% |
| Average credit limit | £5,500 | £5,565 |
| Average over-limit spend | £120 | £95 |
| Cash sales/total sales | 1.25% | 0.91% |
(Source: FICO)
As of May 2022, the average card balance in the UK was £1,555, up by 0.2% from April 2022, and 5.5% from May 2021. The percentage of payments in relation to balance stood at 42.1%, around 6% up from the previous month and 18% from the same time the previous year.
Compared to May 2023, a slight change can be seen in the UK credit card landscape. Average credit card spending rose to £800, around 3% less than the previous month, but a 6.1% increase over the previous year. Average card balances stood at £1,675, a year-on-year increase of 7.7%. However, the percentage of payments in relation to the balance stood at 39.4%, representing a decrease of over 6% since May 2022.
In terms of missed payments, just under 1.6% had one missed payment in May 2023, with 0.3% having missed two, and 0.2% three. All of these figures were up by between 9% and 27% from May 2022, highlighting the fact that people were finding it increasingly difficult to meet payment demands.
Average UK credit card spend statistics 2023
Recent credit card statistics found that the average credit card spend in the UK was £800 in May 2023, continuing a recent upward trend in credit card spending.
In December 2021, the average monthly spend on UK credit cards was £760. However, over the past few years, there have been some significant fluctuations in this figure, going from £697 in December 2019, to a low point of £476 in May 2020.
A breakdown of the average monthly spend for UK credit cards over time
After this, it rose back up to £663 in December 2020. There was a further drop to £547 in February 2021, before it ascended again to reach its peak in December 2021.
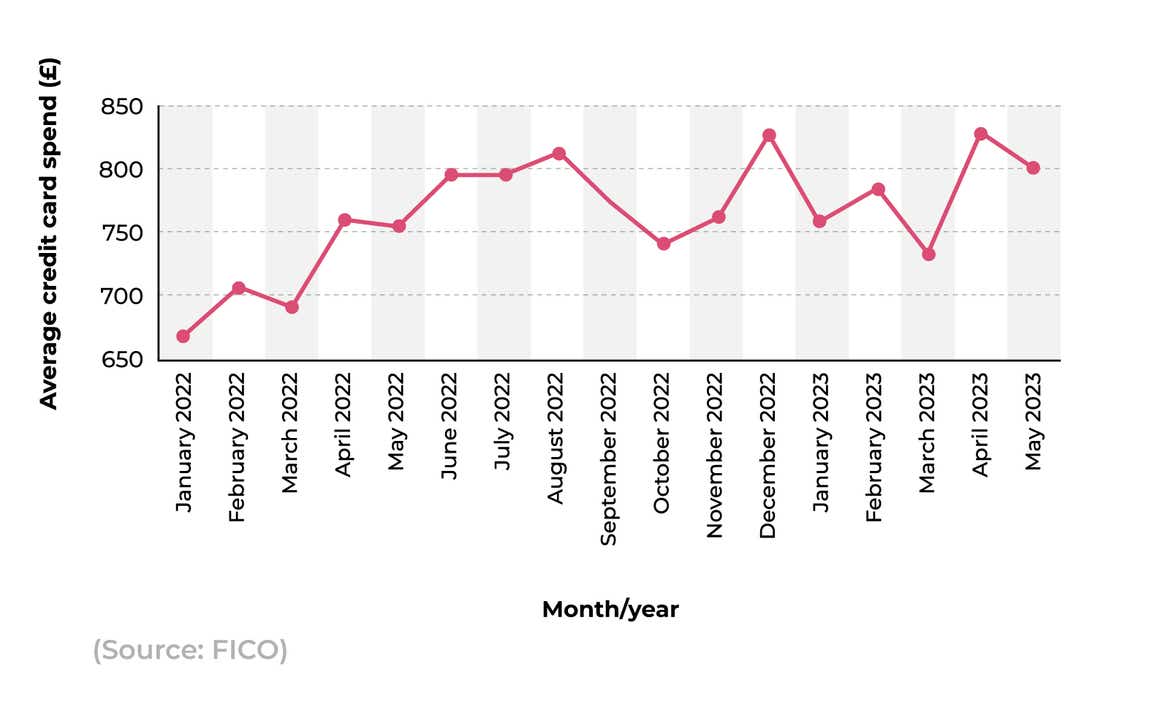
Average credit card spending in the UK rose back up to £663 in December 2020. There was a further drop to £547 in February 2021, before ascending again throughout 2021.
Things would continue to increase in 2022, with average credit card spending exceeding £800 for the first time in August, before peaking at £825 in December 2022. The figures for May 2023 mark a 3% decrease from the previous month, but a 6% increase from the same time in 2022.
Average UK credit card balance statistics and % payments to balance
Average credit card balances in the UK have fluctuated considerably in recent years, with the average balance dropping from about £1,720 per month in December 2019, to just over £1,450 in May 2021.
Since then, they have steadily increased, peaking at £1,680 in April 2023. The latest credit card statistics found the average credit card balance was £1,675 in May 2023 – an increase of 7.7% from May 2022, and a rise of nearly 14% from May 2021.
A breakdown of how the average active balance and percentage of balance paid for UK credit cards have changed over time
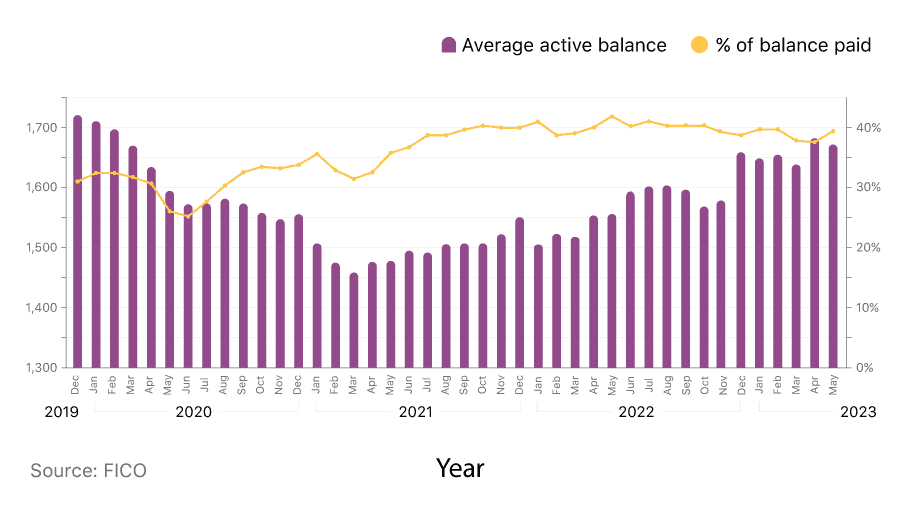
In terms of percentage payments to balance, figures remained consistently between 25% and 40% throughout 2020 and 2021, reaching the lower of the two values in June 2020 and the higher of the two in October 2021.
In January 2022, however, the percentage of payments to balance rose to 41.5%, with this figure exceeding 42% by May. Things began to reduce towards the end of 2022, with the latest figure for May 2023 standing at 39.44% – down around 6% from the previous year.
Choose a balance transfer credit card that could save you interest on your debt
UK contactless credit card payment statistics
Contactless payments account for nearly two-thirds (63%) of all credit card transactions, as of June 2023.
This was up from 60% the previous June, and 51% in June 2021, a rise of 12% over two years. By comparison, more than three-quarters (76%) of debit card transactions in June 2023 were contactless – up from 74% in June 2022, and 66% in June 2021.
Credit card vs. cash statistics
In 2022, there were 21.6 million consumers who used cash only once a month, or not at all. This was a decline of around 1.5 million from the previous year, but an increase of nearly eight million from 2020, highlighting the growing trend of people now living a cashless life.
Nonetheless, there were still 0.9 million customers who mainly used cash for their day-to-day expenses, such as shopping in 2022. This represented a small decline of 0.3 million from the previous year, and a decline of 57% from 2019, when the figure stood at 2.1 million.
Choose a 0% credit card that could save you money on purchases you make
Use of cash vs. credit cards as a payment method since Covid-19
The Covid-19 pandemic caused multiple changes to the way in which society operated, and one of those affected was the use of cash as a payment method. The use of cash for all services has more than halved since the outbreak of Covid-19.
A breakdown of how UK consumers’ cash spending habits have changed since Covid-19
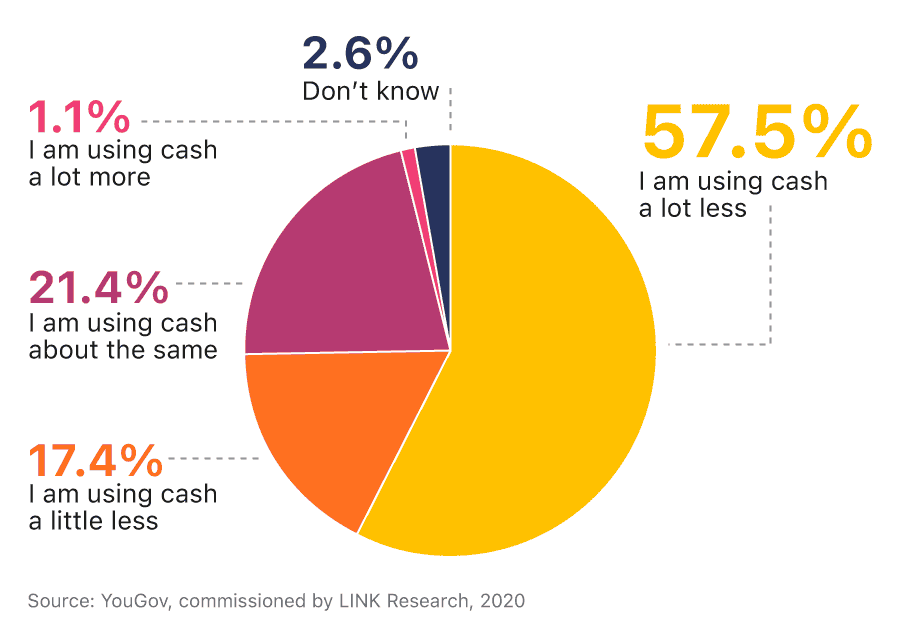
Almost 75% of people are using less cash in general, with 57.5% of people stating they are using it a lot less. One in every five people found there was no change to the way they used cash, and 1% said they were using more.
A breakdown of the extent to which UK consumers have replaced cash with credit and/or debit cards
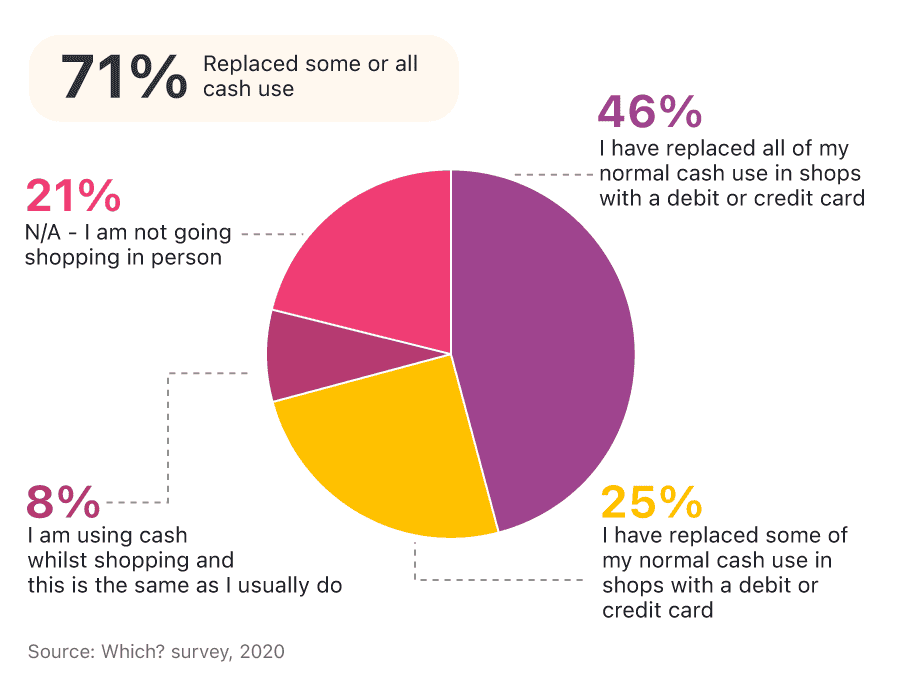
A study by Which? found that 71% of shoppers have replaced cash with card payments to some extent, with nearly half (46%) now paying entirely with a credit or debit card, as opposed to cash, compared to December 31st, 2019. By contrast, only 8% claim to be using cash in the same way that they normally do.
In 2019, card payments accounted for over half (51%) of all payments in the UK. Cash payments decreased by 15% to 9.3 billion, but still remained the second most frequently used payment method at 23%.
By comparison, debit cards were the most common, with 17 billion payments, and credit cards accounted for 3.3 billion. That’s an increase of 777% on the previous year, largely due to the increase of contactless credit cards.
A breakdown of how many UK adults use cash once a month or not at all
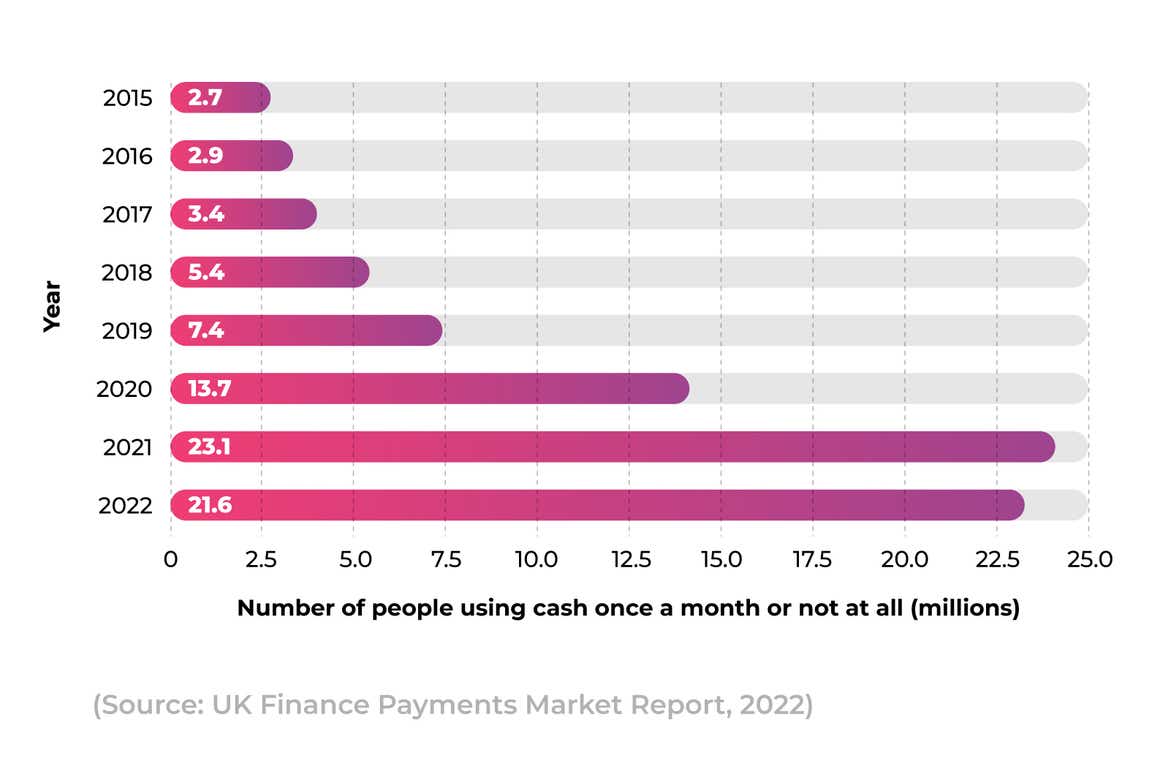
The latest UK credit card statistics show a huge increase in the number of people not using cash over the last five years. The number of people who were not using cash, or only using cash once per month, more than doubled between 2017 and 2019, from 3.4 million to 7.4 million, respectively.
These figures would then accelerate by 85% in 2020, with the COVID-19 pandemic increasing the need for more cashless payment facilities. Numbers would peak in 2021 at 23.1 million, a rise of almost 69% from the previous year.
The following year, figures declined by 6% in 2022 (21.6 million), suggesting people may be using cash increasingly to monitor their spending during the cost-of-living crisis.
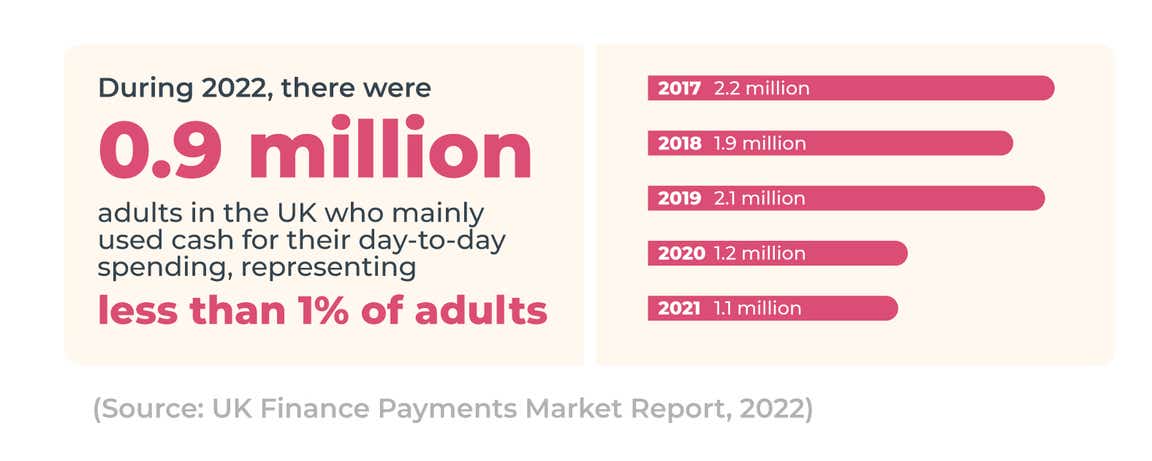
Conversely, the number of UK adults who mainly used cash for their day-to-day spending dropped from 2.1 million in 2019 to 0.9 million in 2022, which is less than 1% of UK adults.
Credit card usage between age groups
Young people are leading the way as the age group least dependent on cash as a form of payment. However, generally, people across all age groups are rarely using cash, with 7% of the over 65s using cash once a month or less in 2019.
A breakdown of how many UK adults use cash and credit cards for day-to-day payments across different age groups
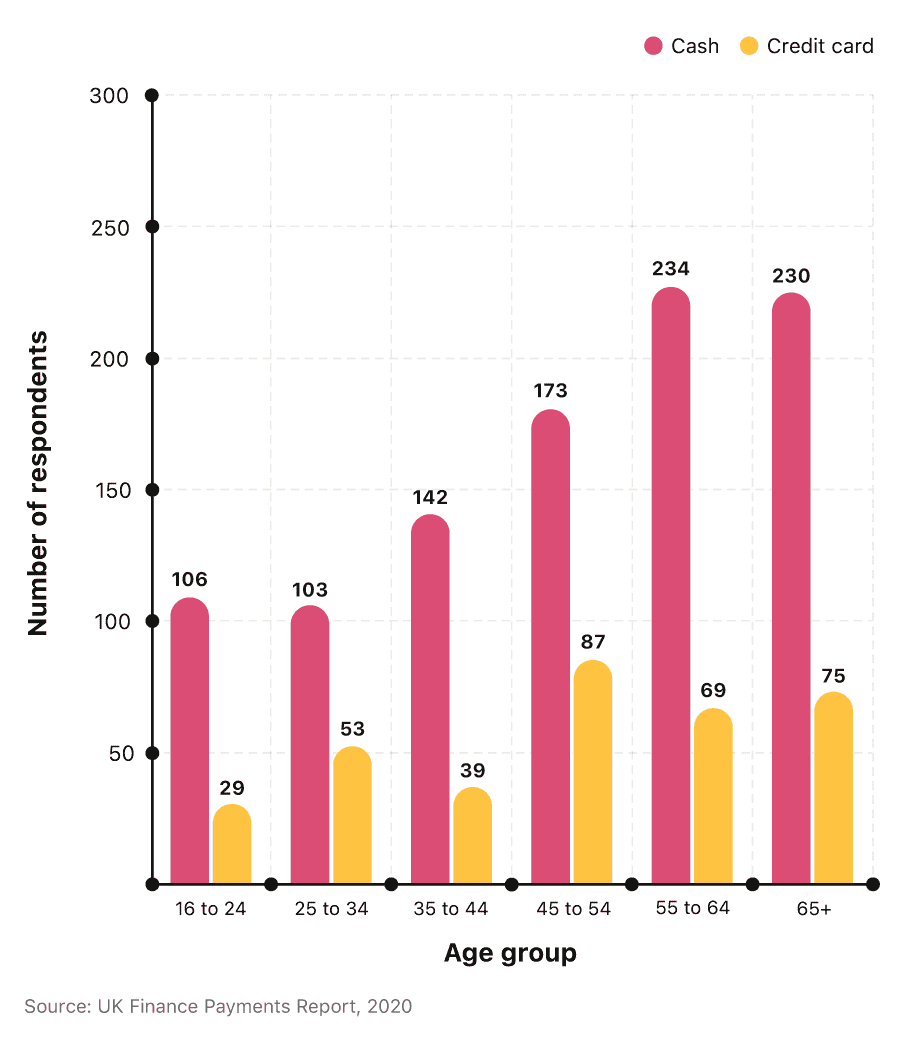
Adults over 55 years old are more than twice as likely to pay by cash, compared to those under 35. Credit cards are most popular for those between the ages of 45 and 54. This age group are more than three times more likely to use a credit card as their preferred payment option compared to 16-24-year-olds. Despite this relative popularity, almost twice as many in the 45-54 age bracket prefer using cash as opposed to credit cards when making daily payments. Over 65s are three times more likely to choose cash over a credit card, and are the second largest users of each of these respective payment methods.
A breakdown of the preferred payment method for UK adults when it comes to spontaneous payments
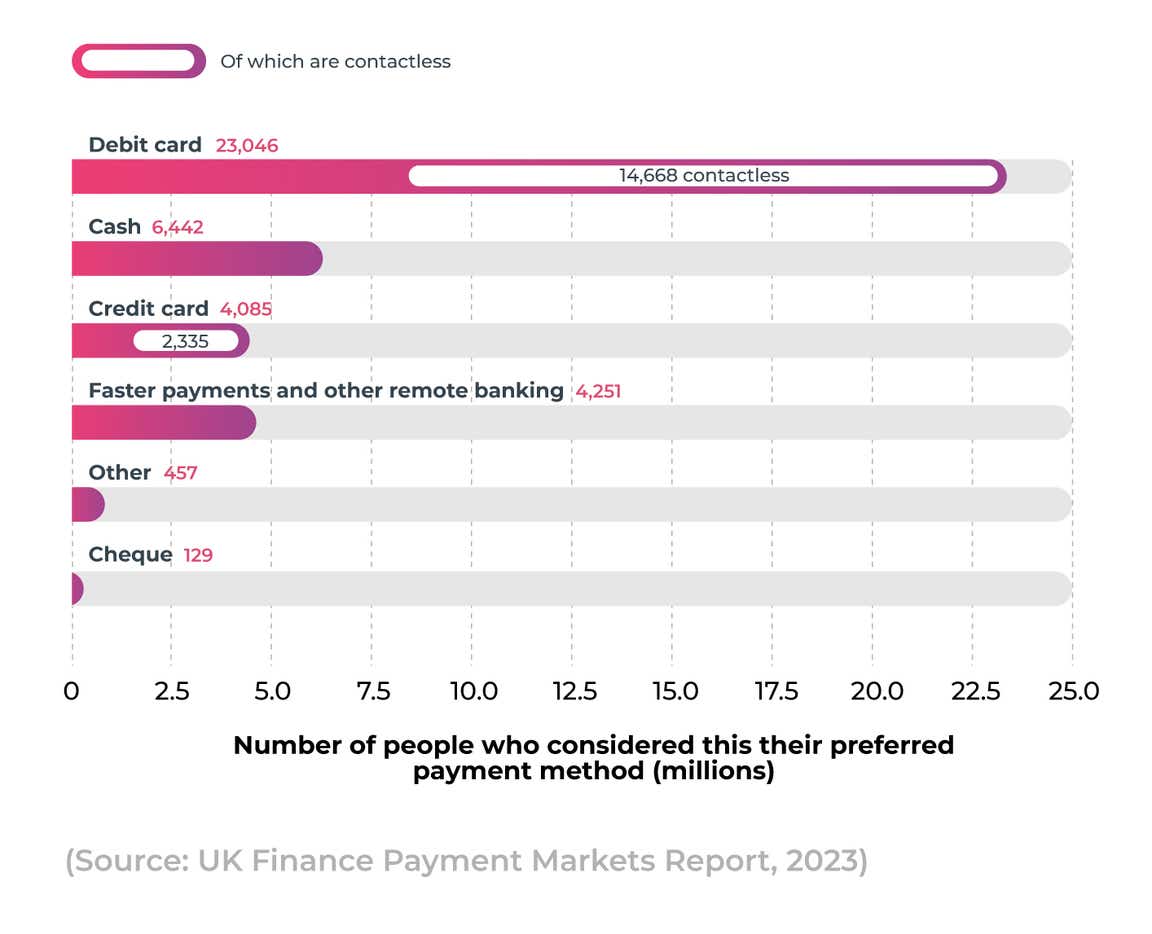
When it comes to settling spontaneous payments, fewer than three-quarters (71%) of people will use a payment card, with the overwhelming majority (60%) preferring a debit card, and almost 11% opting for a credit card.
Cash, by comparison, is used in almost 14% of purchases, making it the second most popular choice amongst shoppers.
A breakdown of the total amount of cash payments in the UK over time
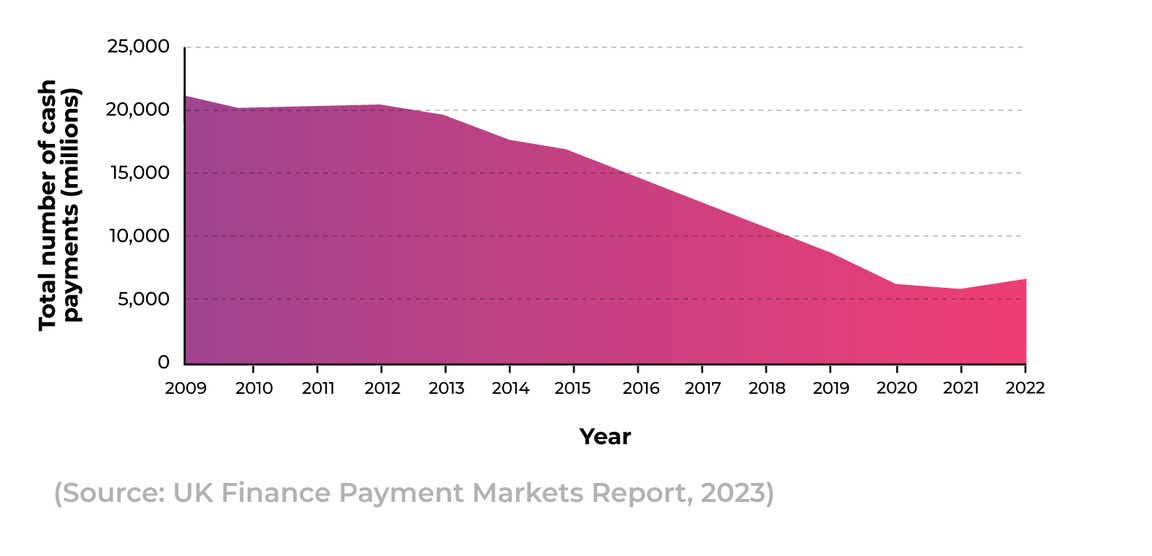
The decline of cash as a payment method has been happening for some time. Back in 2009, over half (58%) of payments were cash, whereas, over the next 10 years, this number had more than halved to 23%. The decline in cash continued past 2020, reaching its lowest point in 2021, when less than six billion (14%) transactions were cash-based.
Despite an increase in cash transactions in 2022, the overall percentage of cash transactions fell from close to 15% to 14%. If these trends prevail, then cash payments could account for around 10% of all payments by 2029.
Breakdown of different credit cards
Deciding on the best credit card for you is dependent upon a number of factors, one of which is the rate of interest you will pay on your borrowing.
Of British credit card holders, 36% are paying some level of interest on their balance, with the average being £121.40 a month (or £1,456.80 a year). On average, men pay £53.90 a month more than women, although nearly a third are not carrying any balance at all on their card(s).
The competitive nature of the credit card industry means that providers are always looking to entice customers with attractive deals and offers. In 2021, it was estimated that 31% of Brits made use of a credit card deal.
Of these:
17% of these had an interest-free balance transfer credit card deal
8% had an interest-free credit card offer,
6% paid no interest on their money transfer deal.
UK credit card growth rate
The annual growth rate for all consumer credit in August 2023 stood at 7.6% – a 0.3% increase over the previous month. However, this doesn’t tell the full story of the previous 11 years, in terms of the UK’s credit card growth rate.
In January 2010, the 12-month growth rate on total net UK credit card lending stood at +4.2%. By October 2012, this had dropped to +0.8%, after which there was a general upward trend until June 2018, when the rate reached a peak of +9.4%.
Between 2018 and 2021, the growth rate declined rapidly, bypassing 0% for the first time since 2010 in March 2020. The lowest growth rate was a staggering -21.2% in February 2021. Between then and September 2021, it increased back up to -4.2, before returning to positive figures throughout 2022 and 2023.
As of August 2023, the annual growth rate for UK credit card borrowing stood at 11.8% for the second consecutive month.
UK credit card default rate
A credit card default rate is a higher rate of interest which is payable if the borrower fails to keep up with credit card repayments. Between 2018 and 2021, lenders experienced a fluctuating picture with regard to default rates.
A breakdown of how the bank credit card default rate has changed in the UK over time
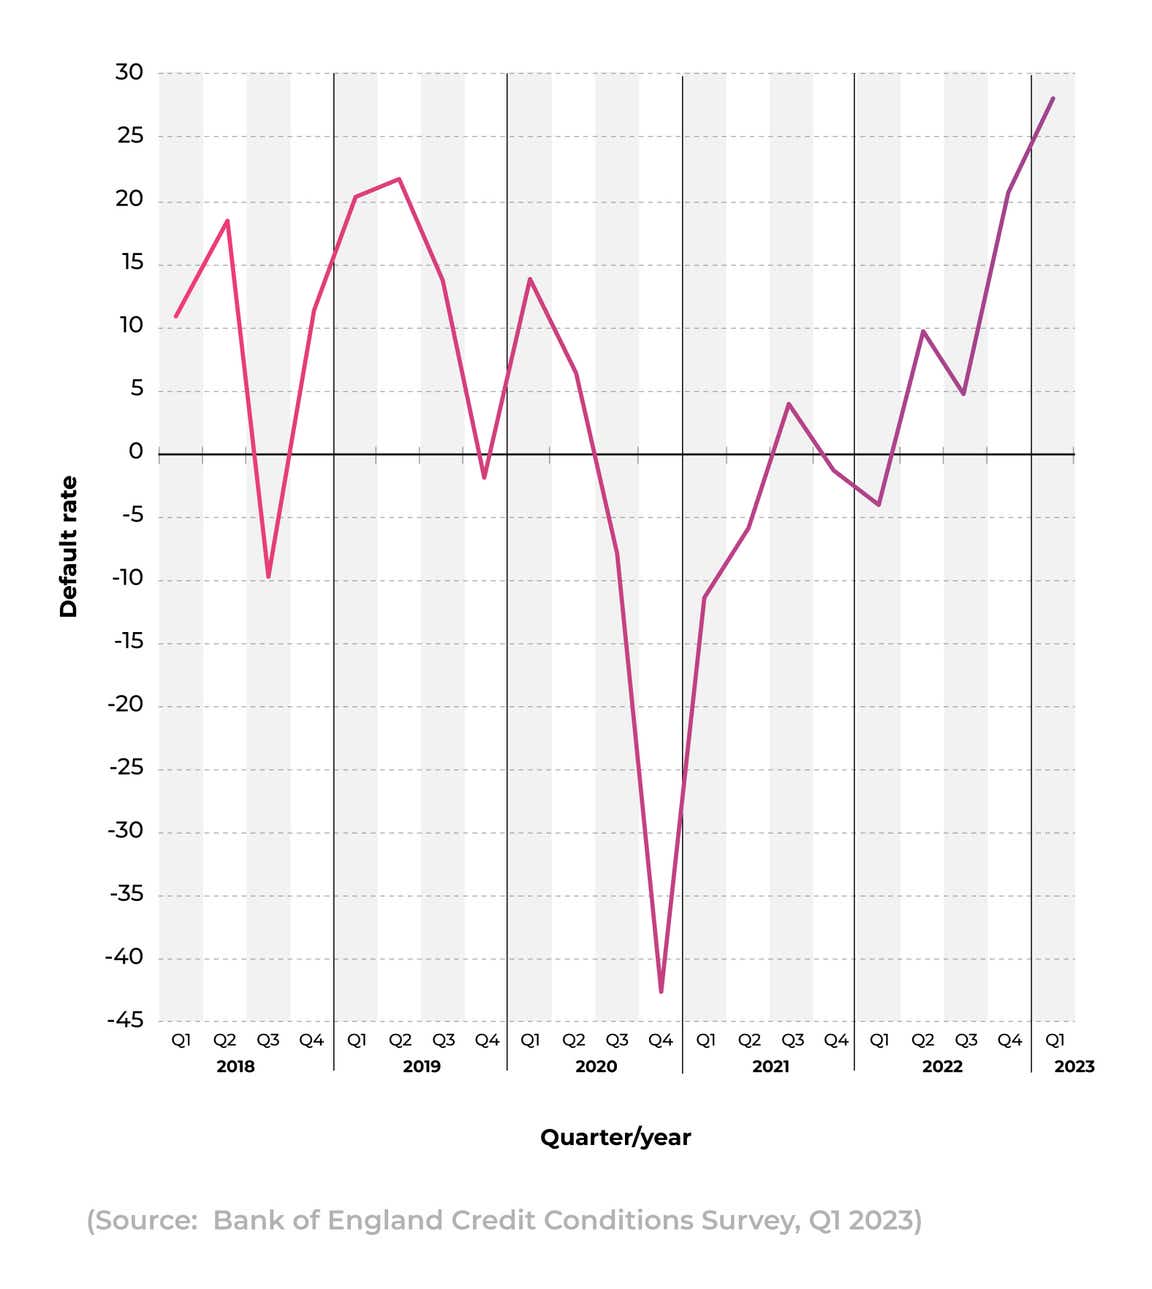
The first quarter of 2020 saw an increase of 14.1 in the credit card index rating, while the final quarter of that year saw a drop of 42.2. The index rating significantly increased throughout 2022, with the first quarter 2023 rate being 27.2, the highest figure recorded since the third quarter of 2009.
A breakdown of how the UK average credit card interest rate has changed over time
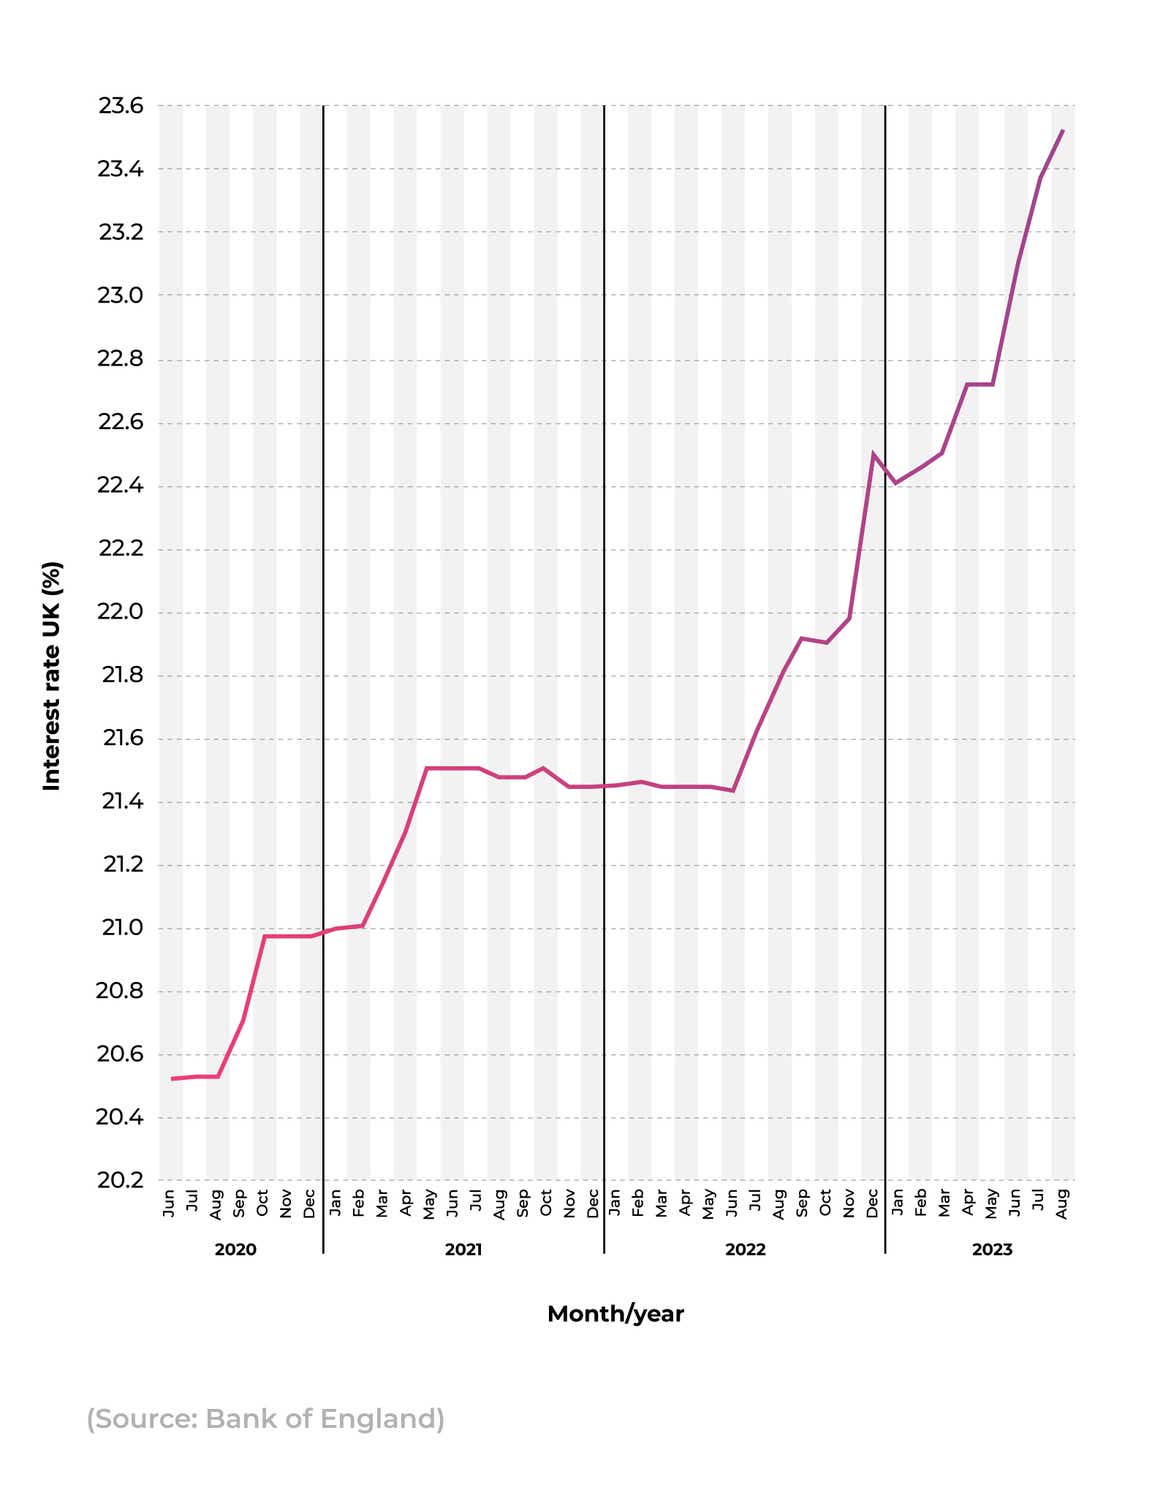
The latest UK credit card statistics found that the average interest rate on credit cards was 23.57% in August 2023. This represented an increase of 0.19% from the previous month (23.38%), and a 1.77% increase from August 2022 (21.8%).
UK interest rates for credit cards rose sharply in the first half of 2021, increasing from 20.99% in January 2021 to reach 21.49% in May 2021. The rate then largely plateaued until the middle of 2022 before rising once more to reach 22.42% in January 2023, and then surpassing the 23% mark in June 2023.
In May 2022, the UK average interest rate on credit card lending was 21.38%. This was over 20% above the BoE base rate (1% at the time). The base rate was raised on 16 June 2022 to 1.25%, and increased further on 4 August 2022, to 1.75%.
The rate has been climbing ever since. On 3 August 2023, the BoE raised the base rate to 5.25%, the highest figure in 15 years.
A breakdown of how the UK credit card interest rate compares to other interest rates for other aspects of borrowing over time
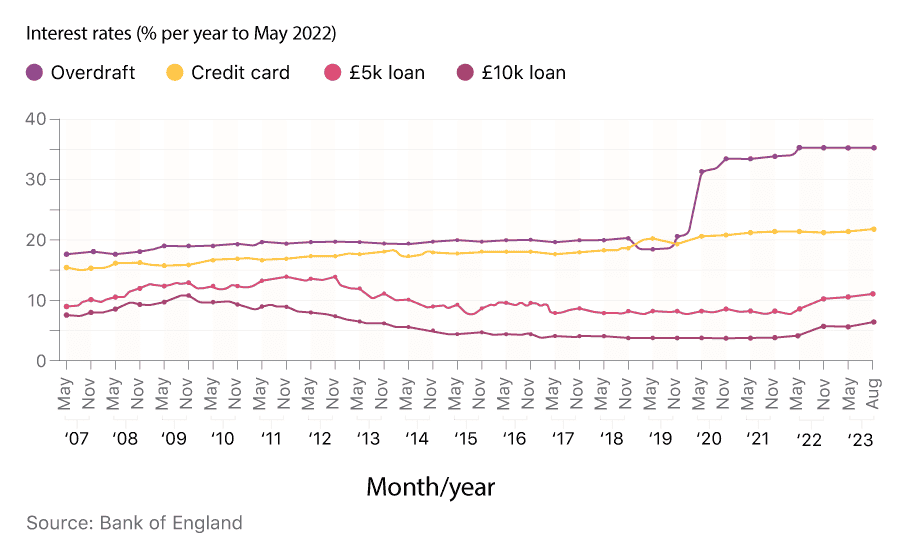
Recent UK credit card statistics found that the average interest rates on credit cards remain substantially below those found on overdrafts. With average interest rates of 35.4% as of August 2023, those with overdrafts will typically pay interest rates around 11.6% higher than those with credit cards.
However, interest rates were substantially higher on credit cards than on personal loans. The UK average interest rate on a loan worth £10,000 was 6.88% in August 2023 – less than a third of the interest on a typical credit card. Similarly, loans worth £5,000 (11.28%) were found to have average interest rates less than half that of the average credit card.
Credit card savings
The Money Charity estimates that the average UK credit card debt per household stands at £2,363, as of April 2023.
Between September 2021 and November 2021, there was a 27% increase in people applying for a balance transfer credit card, compared to the same time period in 2019. There are currently about 60 0% balance transfer credit cards available online in the UK–at the start of the 2010s, there were over 140.
The number of people pre-approved for a credit card also rose by 14% in November 2021, compared to November 2019.
Half of people surveyed by Experian in December 2021 claimed they were planning to be more careful with their money in 2022, stating that the pandemic had made them reevaluate their financial situation. 23% expressed concerns for their financial future, with over a quarter (27%) more concerned about going into debt over the Christmas period of 2021 compared to the previous year.
Which credit card providers offer the longest interest-free periods on balance transfer cards?
Based on the balance transfer cards available through Uswitch, Barclays had the longest interest-free balance transfer card available as of October 2023, with its Platinum Balance Transfer card offering 0% interest for up to 29 months.
Users of this card pay a balance transfer fee of 3.45% upon taking out the card, but are then charged no further interest (provided they paid off the full balance within 29 months).
A breakdown of the balance transfer credit cards with the longest periods of 0% interest
| Balance transfer card | Period of 0% interest | Balance transfer fee |
|---|---|---|
| Barclaycard platinum balance transfer (29 months) | 29 months | 3.45% |
| M&S Bank Transfer Plus Credit Card | 28 months | 2.99% |
| Santander Everyday Long Term Balance Transfer Card | 26 months | 3% |
| Virgin Money Balance Transfer Card (25 months) | 25 months | 3% |
(Source: Uswitch)
Marks and Spencer’s (M&S) Bank Transfer Plus card offers the next longest 0% period as of October 2023, at 28 months. Though this was a month less than Barclays’, with a balance transfer rate of 0.51% less by comparison.
How many customers pay off their balance transfer card within the interest-free period?
The most recent UK credit card statistics from the Financial Conduct Authority on the subject found that almost half (48%) of consumers pay off the full amount of their balance transfer within the 0% promotional period. This figure rises to 54% when including people who paid within two months of the 0% rate expiring and 60% for those who paid within three months.
A breakdown of how many customers pay off their balance transfer within six months
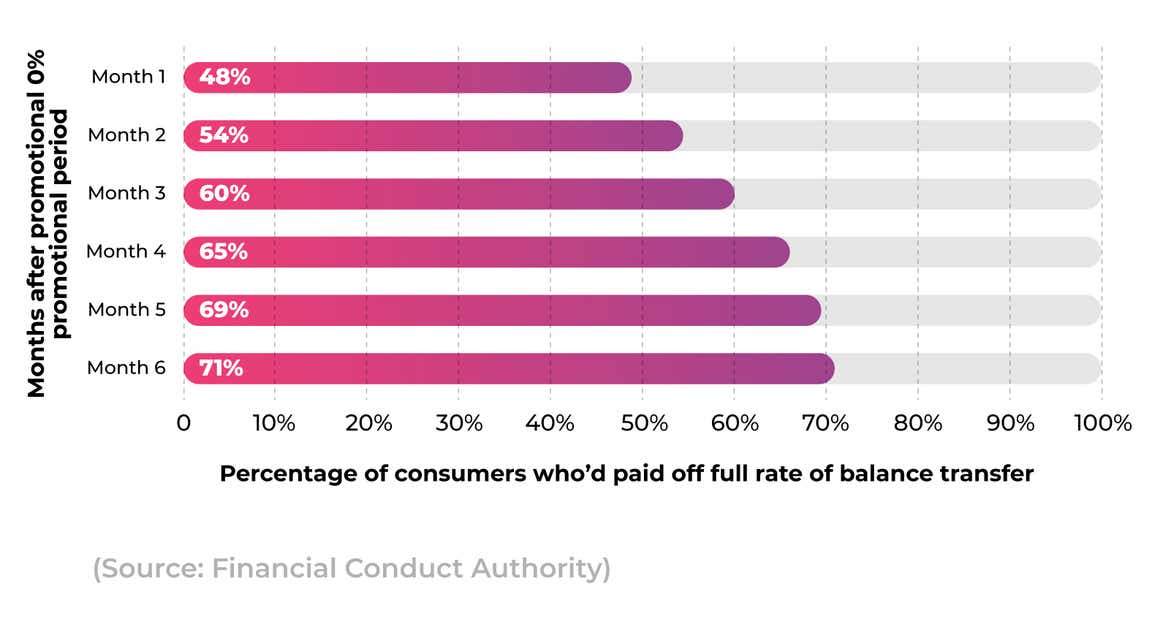
The rate of full payment begins to slow after month three, with almost two-thirds (65%) having paid off the balance by month four and 69% after month five.
By month six, 71% of people had paid off their balance transfer card in full, meaning just under three in 10 are still paying off their balance six months after the introductory offer has expired.
Credit card network statistics
There are somewhere in the region of 472 credit card businesses in the UK, employing around 8,700 people. Of these companies, Visa and Mastercard continue to reign supreme in the world of credit cards.
At the end of the first quarter of 2023, over 1.2 billion Visa credit cards were in global circulation. By comparison, there were 1.1 billion Mastercard credit cards. As of 2022, there were over 133 million American Express (AMEX) cards in circulation.
According to net e-commerce sales for 2020, virtually all (98.5%) of the top 500 online shops offer payment by either Visa or Mastercard, making them the most frequently offered payment method in the UK.
PayPal is the third most popular, with 77%, and American Express (Amex) is fourth with just under 64%.
A breakdown of how UK credit card transactions have changed over time for different providers
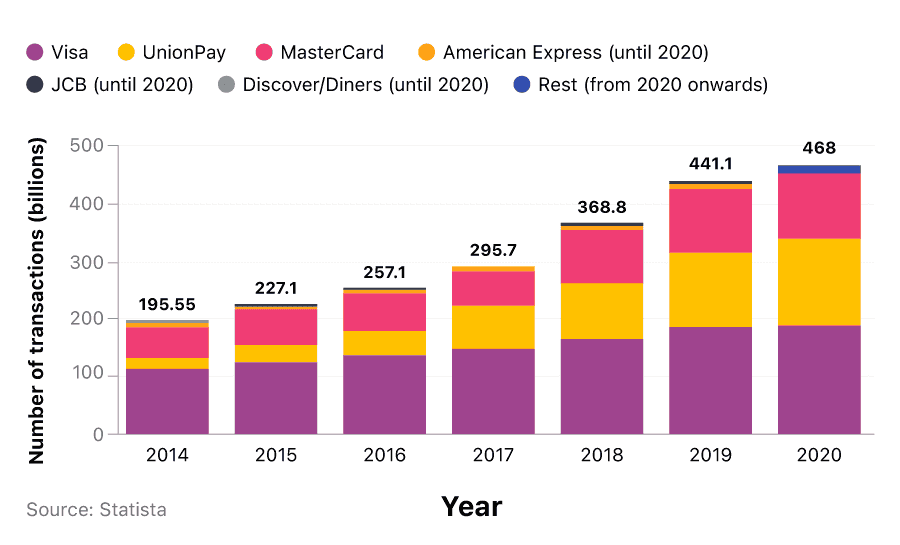
Between 2014 and 2020, credit card transactions increased by over 40%. Visa continues to dominate the market, with roughly 188 million purchase transactions in 2020, an increase of 1.3% from the previous year.
Globally, in 2020, there were roughly 188 billion purchase transactions made using Visa–-an increase of 1.3% from the previous year. By comparison, this was significantly lower than the 15% growth year-on-year for UnionPay.
UK credit score statistics
A credit score (also known as a credit rating) is a number generated by a credit reference agency (CRA) that reflects how reliable you are when it comes to repaying money that you have borrowed. This score will take into account your repayment history, and how you have handled money in the past.
The higher your number, the greater your chances are of being accepted for future lending. The lower your score, the less likely you are to secure any future borrowing, and if accepted, you are also likely to be offered the least desirable rates for repayment.
Almost 70% of UK residents do not know their credit score. Your credit rating can influence your chance of obtaining a whole range of products and services, including credit cards, loans, and mortgages.
Credit Reference Agencies (CRAs) in the UK
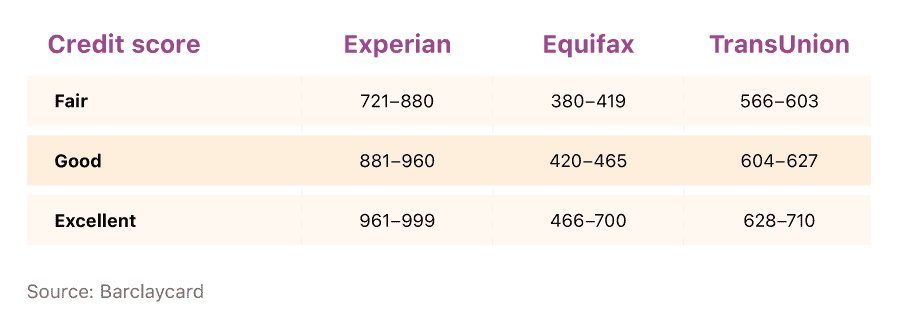
There are three main CRAs in the UK: Experian, Equifax, and TransUnion. Each CRA uses a different scale to assess a consumer’s credit score.
Experian
Experian is the largest CRA in the UK, and a rating of 721-880 by them is considered ‘fair’, 881-960 is perceived as ‘good’, and anything 961 or above is rated as excellent.
A breakdown of fair, good, and excellent credit scores for different UK credit reference agencies
The average UK credit reached 797 in September 2021, falling under the ‘fair’ category. This was up from 792 in 2020, and 776 in 2019.
The highest average scores can be found in the City of London (893), followed by the Isles of Scilly (886), and Wokingham (880). By contrast, Kingston-upon-Hull has the lowest average score (702), with Blaenau Gwent and Blackpool marginally ahead, with respectively low scores of 707 and 713.
Generally, those over 55 have the highest average scores, with 863, whereas people in their 20s fare worse than teenagers. Those aged 18-20 years old have an average score of 823, compared to 792 for 21-25-year-olds. This may be partly due to the credit card age limit in the UK being 18 years old, and thus the take-up of credit cards is likely to be low for this particular age bracket.
The lowest of all age groups is those between 31 and 35, with an average credit score of 770.
TransUnion
The maximum possible score from TransUnion is 710, with the UK average estimated to be around 610.
TransUnion (formerly known as Callcredit) is the UK’s second-largest CRA and has much smaller ranges for each category of credit rating. 561-565 is considered ‘poor’, 566-603 is considered ‘fair’, 604-627 is rated as ‘good’, and anything over 628 is viewed as ‘excellent’.
Equifax
According to Equifax, the average credit score in the UK is around 380 out of 700, which falls into their pre-2021 definition of ‘fair’.
Under their new definitions, imposed in April 2021, a score of 531-670 is considered ‘good’, 671-810 is categorised as ‘very good’, and anything over is considered ‘excellent’.
Credit score myth-busting
There’s a lot of misinformation out there when it comes to credit card scores. There are a number of factors that can influence your credit score, either positively or negatively.
Our credit card expert Salman Haqqi sets the record straight.
| Perception | Fact or fiction? | Reason |
|---|---|---|
| Making a large purchase on your credit card (e.g. a holiday or a new car) will affect your score | Fiction | What you use your credit card for has no bearing on your credit score. |
| There are no real benefits to a balance transfer card | Fiction | A balance transfer card with a 0% interest offer helps you pay off your debt quicker. With no interest to pay for a set period, all your repayments go towards paying off your balance, so you save on interest. |
| You should always owe some money on your credit card to improve your credit score | Fiction | To improve your credit, you need to make sure you make repayments on time. Paying your balance in full only goes further in telling lenders that you’re a responsible borrower. |
| Interest on credit cards becomes payable immediately after a purchase is made | Fiction | Interest is only charged at the end of each monthly billing cycle. If you pay off your balance in full, you will not be charged interest at all. |
| Switching your credit cards affects your score | Partly fact and partly fiction | When you apply for a new credit card the provider does a hard check. This leaves a mark on your credit report and can affect your credit score temporarily. It should recover back to what it was, or improve, if you keep up with repayments. |
| The number of credit cards you own affects your credit score | Fiction | As long as you keep up with repayments on all cards, the number of cards you have has no effect on your credit score. |
| Buying a holiday on a credit card gives you more financial protection | Fact | A credit card gives you Section 75 protection, which covers any spending between £100 and £30,000. |
UK credit card debt statistics
One of the biggest fears of owning a credit card is the debt that can be accumulated if you don’t manage your finances effectively and sensibly.
StepChange Debt Charity reported that almost two-thirds (64%) of its 12,500 new clients receiving debt advice in April 2022 had credit card debt.
Outstanding balances on credit card accounts in the UK increased over the course of 2022 and 2023. In June, total credit card debt in the UK stood at £66.4 billion, a substantial climb from the £58.9 billion reported at the beginning of 2022.
By June 2023, borrowers were paying £177 million a day in interest alone and the amount of outstanding consumer credit in the UK increased by £12.1 billion (up just under 6% from June 2022).
A breakdown of total UK credit card debt over time
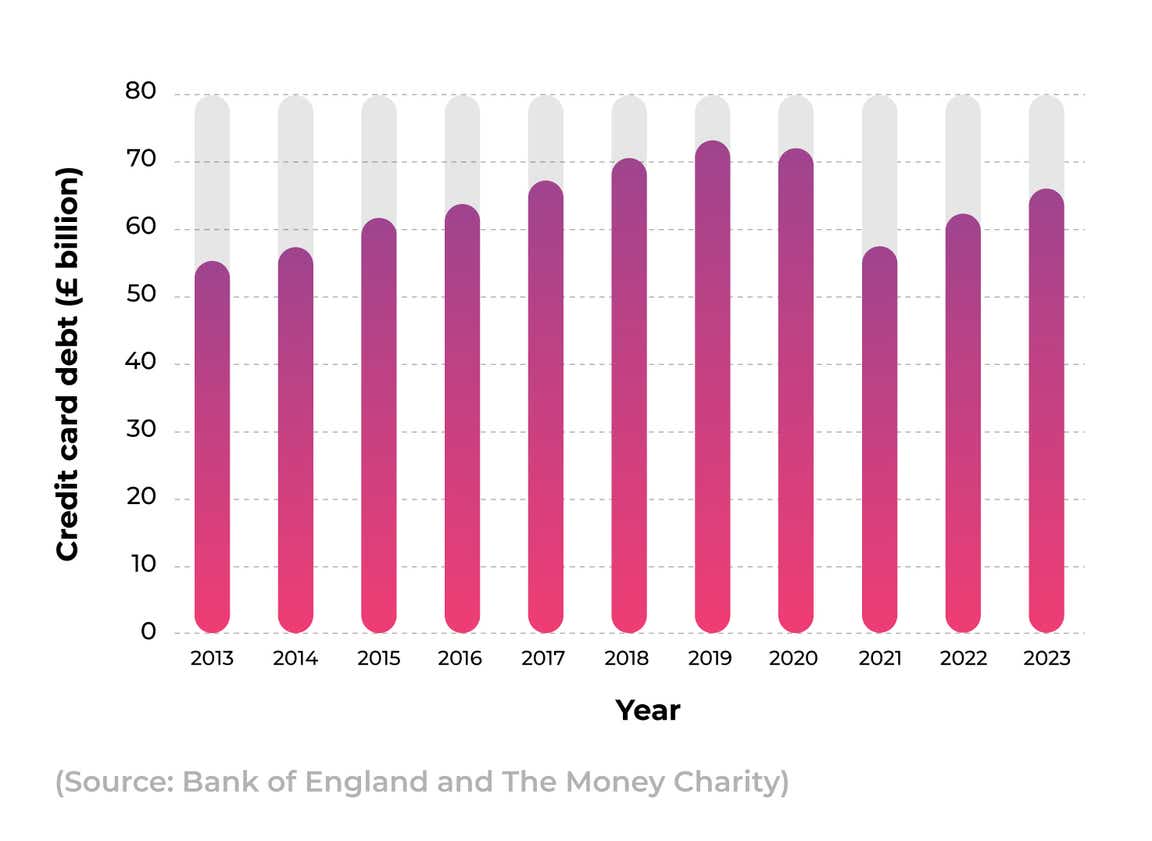
Credit card debt reached £66.4 billion in June 2023 – up around 8% from 2022, but lower than the figures recorded for 2020. This equates to £2,363 per UK household (or £1,248 per UK adult). This is around a 6% increase from June 2022 when the figure stood at £2,229 per household (£1,171 per UK adult).
Furthermore, it’s estimated that UK lenders wrote off £731 million in credit card debt in the first quarter of 2023, amounting to a daily write-off of £3 million.
Credit card debt during and after the Covid-19 pandemic
Since the outbreak of Covid-19 in the UK, 22% (3.2 million) of those affected by the pandemic have fallen into arrears. This is estimated to be around £3.8 billion (roughly £1,3855 per person).
In September 2020, 8% of those who had fallen behind on some form of payment, were struggling to pay back on their credit card borrowing. This was the most common arrear caused by the coronavirus outbreak of 2020. Incidentally, this figure had doubled from 4% in May of the same year.
Around seven million people have taken at least one credit holiday since the pandemic. Of these people, 12% now have severe debt problems, with 22% showing signs of financial difficulty. A further half (53%) were worried about falling behind on essential purchases for the remainder of the year.
The most common source of borrowing was credit cards (17%)–an increase of 5% from May 2020. It is estimated that 9% of those affected by Covid-19 have used one or more forms of high-cost credit borrowing just to survive the pandemic, with 30% turning to credit cards.
Average credit card debt between countries
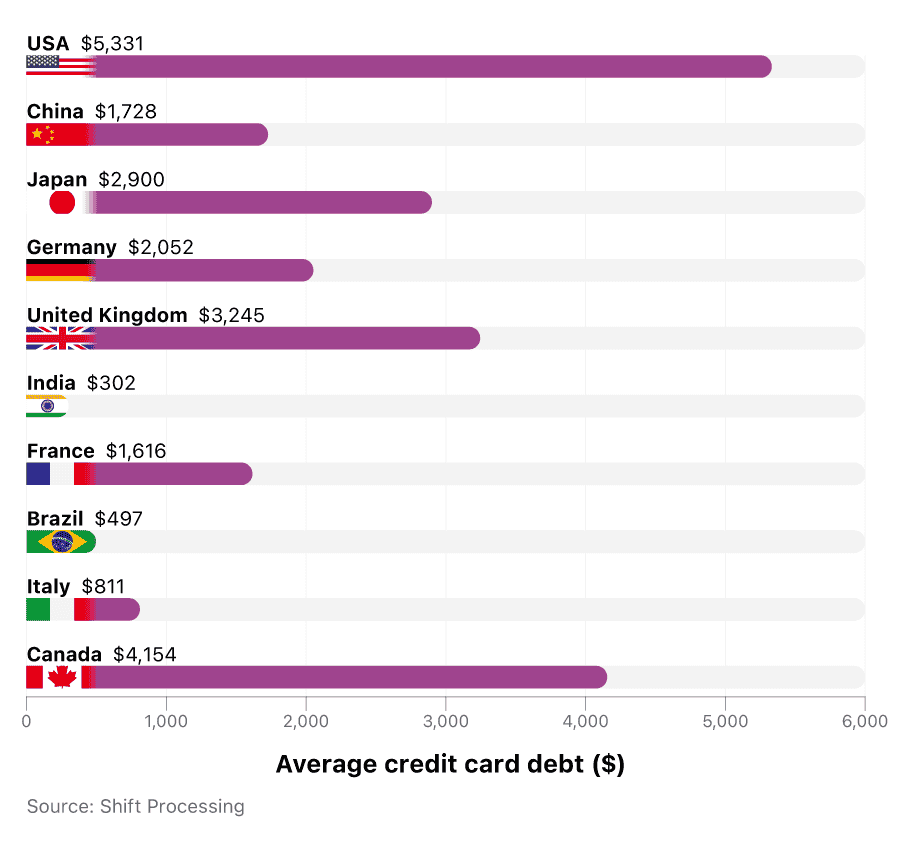
In 2020, the average debt for UK citizens stood at $3,245 (£2,718). Compared to the world’s 10 wealthiest countries in 2020, this places the UK in third for average debt, behind the USA and Canada, despite having the fifth largest economy.
India, by contrast, was the sixth largest economy in 2020, yet only accumulated an average of $302 per person.
A breakdown of average credit card debt for different countries in 2020
Credit card delinquency rates
When a cardholder falls behind on making the required monthly payments, this is known as credit card delinquency.
Throughout 2022 and and into the early summer of 2023 in the UK, credit card delinquency rates remained below 2%, indicating that people were better at keeping on top of their repayments than in the past, although early indicators show the rate has risen in later summer months.
A breakdown of total UK consumer debt over time

This is partly due to the amount of money being lent out by UK banks and building societies. In April 2022, total net lending for these establishments grew by £5.7 billion, at a rate of £190.3 million a day. Consumer credit lending accounted for just over 10% of this increase, at a cost of £593 million.
Personal credit card debt in the UK
Most of us will likely need to borrow money at some point in our lives, whether it’s for a mortgage, planning a wedding, or making an expensive purchase like a holiday or a new car.
As of June 2023, the total amount of UK personal debt stood at an eye-watering £1.84 trillion. This is more than four times the amount for December 1994, and about double that for 2002.
For the average UK consumer, making only the legal minimum repayments each month, a credit card with an average interest rate containing the average debt (£2,363) would take 26 years and three months to repay. In the first month, this would be £65, but would reduce each month as you paid off more of the debt. If £65 were paid off every month, the debt would be clear in five years.
Check out our credit card interest calculator, to see how long it could take you to pay off your credit card debt.
Average UK credit card debt per household
In July 2023, total UK unsecured debt (total consumer credit lending) stood at a staggering £216 billion. This was a rise of £855 million on the previous month, and £11.6 billion more than the previous July, in 2022.
A breakdown of average UK credit card debt per household over time
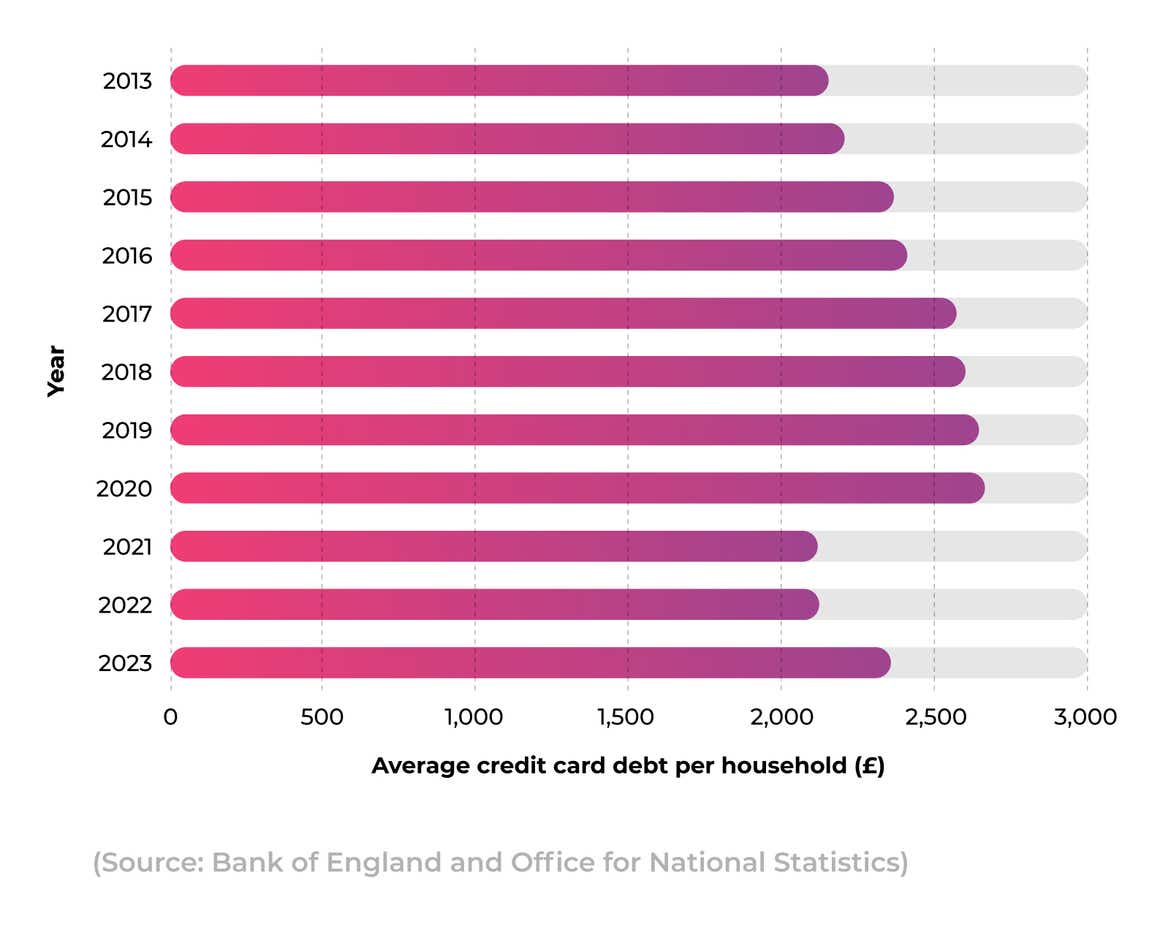
Broken down, this means in July 2023, each UK household was paying on average £2,376, or £1,248 per adult.
Between 2009 and 2019, credit card debt in the UK rose by £600 for the average UK household, from £2,014 to £2,626 (or £1,386 per person). This was followed by a decrease in 2021 and 2022, with average credit card debt in the UK falling below the £2,200 mark.
The latest figures recorded in July 2023 show that the UK average household credit card debt has risen by just over 6.5% since the same time in 2022.
UK credit card debt by age group
When broken down into age groups, it is safe to say that some fare better than others, with regard to paying off their credit card debts.
With an average of £1.091.80, those aged between 35-44 have the largest outstanding balance on their credit cards. Over half of student credit card users (i.e. those aged 18-24) were paying interest on their outstanding credit card balance, at an average cost of £211.20 a month (£2,534.40 a year).
45% of 35-44-year-olds were paying interest on their outstanding credit card balance, compared to 43% of those aged 25-34, and 37% for those between the ages of 45 and 54.
For the over 65s, only 15% accrued interest on their credit card balance, meaning 85% were paying off their balance in full each month.
Naturally, these statistics may stir feelings of worry about credit cards, however, not all age groups unanimously feel the same way.
A breakdown of credit card debt fear amongst different UK age groups
| 2016 | February 2017 | August 2017 | December 2018 | January 2020 | |
|---|---|---|---|---|---|
| 18-24 years old | 25% | 24% | 16% | 15% | 29% |
| 25-34 years old | 49% | 53% | 46% | 53% | 54% |
| 35-44 years old | 48% | 50% | 60% | 53% | 64% |
| 45-54 years old | 48% | 53% | 58% | 50% | 57% |
| 55-64 years old | 52% | 52% | 59% | 52% | 50% |
| 65 years old + | 50% | 66% | 52% | 54% | 67% |
(Source: Statista)
Less than one in three 18-24-year-olds are worried about credit card debt. This makes them the least fearful age group with regard to credit card debt, which has consistently been the case since 2016.
Generally speaking, with the exception of 55-64-year-olds, people have become more fearful over time about credit card debt. 35-44-year-olds, and those aged 65 and over, saw the biggest percentage increase between 2016 and 2020, with 16% and 17%, respectively.
2018 seemed to be a year where the percentages dropped across most age groups compared to earlier years. The exception to this was those aged 25-34, and 65 plus, who both saw an increase in December 2018, but a drop in August 2017.
Credit card crime statistics (including fraud and theft)
Credit card fraud was the most common type of identity theft in 2019, with over 270,000 reports. Overwhelmingly, the most cited fraudulent activity was the opening of new accounts, with 246,000 reports (an 88% increase from 2018).
According to our latest fraud report, this type of illicit activity costs Brits almost £3.5 billion a year.
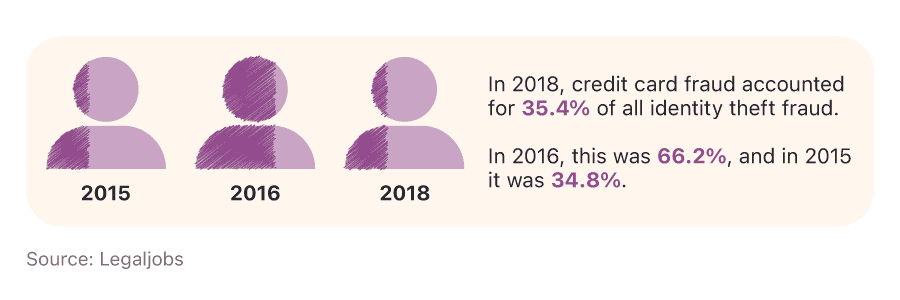
In 2018, credit card fraud accounted for 35.4% of all identity theft fraud in 2018. In 2016, this was 66.2%, and in 2015 it was 34.8%.
According to data obtained from our 2021 fraud report, there were almost 26,500 reported cases of fraud in 2021 involving cheques, plastic cards, and/or online banking accounts. This amounted to over £204 million in losses, with an average loss of £7,714 per victim.

The detected fraud rate for credit cards rose by 42% in the first quarter of 2021, to rates not seen since 2017. Almost three-quarters of cases detected involve the fraudster using the victim’s current address to apply for credit.
How much money is lost through credit card crime?
The actual losses experienced by the card industry are likely to be higher than the reported figures due to the fact that some related costs cannot be accurately calculated, such as resources to investigate fraud, managing call centres, and maintaining operations.
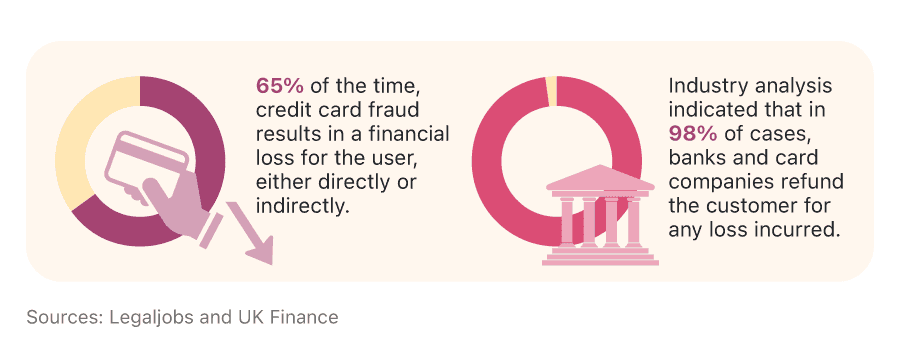
65% of the time, credit card fraud results in a financial loss for the user, either directly or indirectly.
In 2011, global losses from payment fraud exceeded $9.8 billion. By 2020, this figure had tripled to $32.4 billion, and is expected to reach $40 billion by 2027 (25% higher than 2020).
Industry analysis indicated that in 98% of cases, banks and card companies refund the customer for any loss incurred.
In terms of total volume, the global general purpose brand cards (Visa, Mastercard, UnionPay, Amex, Discover/Diners Club, and JCB) accounted for a combined value of $34.17 trillion in 2020. This accounted for 81% of the total global volume.
Total losses for these companies combined in 2020 were $25.27 billion–roughly 88% of all card losses worldwide for that year.
Countries with the most credit card fraud
Over 46% of the world’s credit card fraud happens in the US (25.7% of which were made to an existing credit card).
Ireland is one of the worst affected places by credit card fraud in Europe. 88 out of every 1,000 inhabitants fall victim to credit card fraud, the third highest rate in Europe. This equates to €7,949 of stolen money per person, and €5,145 per 1,000 cards.
A breakdown of European credit card fraud statistics
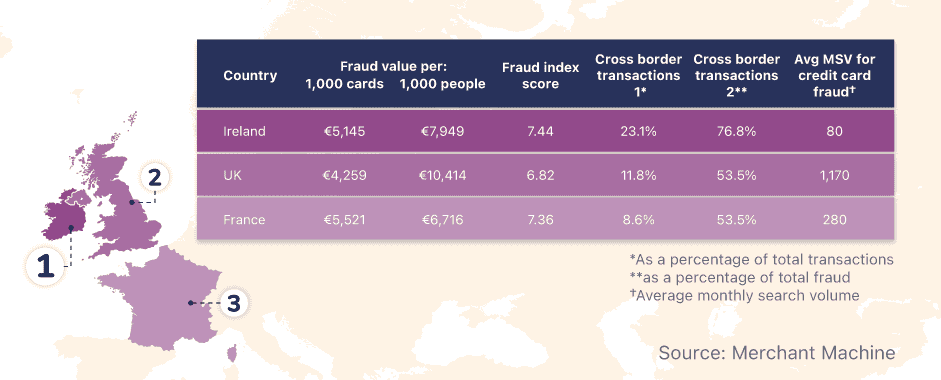
The UK ranks third in Europe for credit card fraud risk, behind France in second place. For every 1,000 credit cards in the UK, €4,259 is stolen by fraudsters. This results in €10,414 per UK citizen (the highest across the continent).
11.8% of fraudulent transactions in the UK happen across borders compared to 23.1% for Ireland. Whilst these numbers may rank low across Europe for this category compared to other countries, this does equate to 53.5% of the UK’s total credit card fraud costs and 76.8% of Ireland’s.
Credit card fraud and the dark web
Over 62% of the UK population owns a credit card. With a population of more than 67.3 million, this equates to around 34.4 million credit cards registered to UK citizens. Compared to other countries, this is moderately high. Canada has 82% credit card ownership, whereas Japan has almost 70%. In the USA, two out of every three people own a credit card.
A breakdown of UK credit card statistics and card fraud
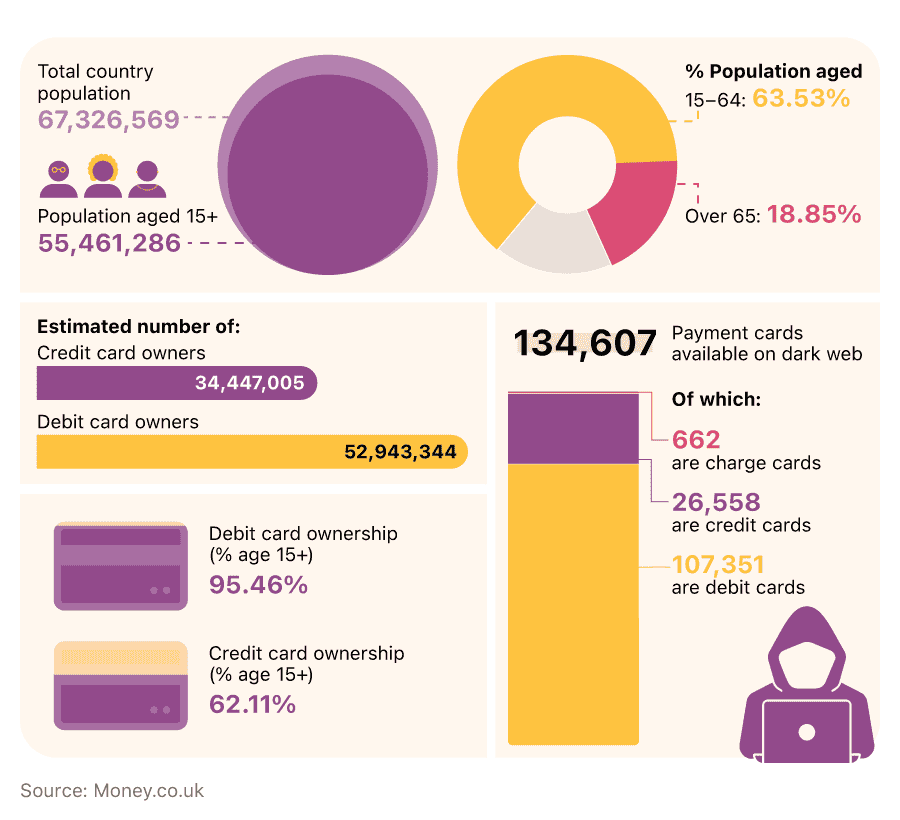
In terms of payment cards available on the dark web, the UK has over 134,000. Of these, 26,558 can be attributed to credit cards, representing almost 20% of the total.
Five other countries in the world rank higher than the UK for the number of payment cards on the dark web, ranging from the USA in first position with more than 1.5 million, to France with 154,000.
The UK ranks ninth in the world for the number of credit cards on the dark web. The USA, in first, has over 747,000, representing 48% of their total. However, Brazil, in second place, has more than 212,000 credit cards on the dark web, yet this equates to an astonishing 94% of their total amount.
Incidentally, Chile has just over 4,000 payment cards on the dark web. 3,964 of these are credit cards, accounting for almost 99% of their total amount.
Credit card data breaches
Credit card fraud statistics for the first half of 2019 indicate a 54% increase in reported breaches, compared to the same time period in 2018. This is occurring at a record pace, with 4.1 billion records exposed across 3,800 publicly disclosed breaches between January 2019 and June 2019.
Globally, it is estimated there are over 4,800 websites compromised each month. Once 10 stolen cards have been compromised per website, this can yield up to $2.2 million (£1.8 million).
For example, the British Airways attack of 2018, where more than 380,000 cards were stolen, may have pocketed criminals more than £17 million.
As of 2022, 19% of businesses that reported the most disruptive cyber security breaches, did so to their banks, building societies, and/or credit card companies.
Money.co.uk credit card survey results, 2022
We polled 2,000 adults around the UK aged 18 and over to find out about their credit card usage habits.
52% use more than one credit card per month
The majority (37%) have only one card in their name, with the average person having 1.2 cards. Of those with more than one credit card in their name, more than half (52%) actively use more than one per month. This is most common among those aged 45-54 (61%), followed by 18-24-year-olds and 35-44-year-olds (55%).
Over a third (37%) of those polled use a 0% credit card to transfer their monthly credit balance. Men are more likely to do this than women (40% vs 35%), and this is most common among those aged 18 to 24 (60%).
62% pay off their credit card balance in full every month
Despite six in 10 (62%) paying off their credit card balance in full each month, 31% don’t, and 7% have never paid off their balance. Men are more likely to have never paid off any of their credit card balance, with 8% having never done so compared to 6% of women.
Those aged 18 to 24 are most likely to never pay off their balance, with almost 2 in 10 (18%) never doing so. Of the remaining respondents in this age group, 28% don’t pay off their balance in full each month, and 54% always pay off their balance.
Of those who don’t pay off their credit card balance in full, 48% only pay the minimum requirement on their statement. This is typical of those aged 18 to 24 (61%).
Comparatively, men are most likely to pay off their credit card balance in full each month (63%), along with those aged 55 and over (74%). Residents in the South East are most likely to always pay off their balance in full (69%), followed by the South West (67%). Comparatively, residents in the East Midlands and Greater London are most likely to never pay off their balance in full each month (11%).
£3,000 = the average debt of UK credit card users
The majority of respondents have a debt of between £500 and £1,000 (37%). This is the case among males and females, with 31% and 45% selecting this in our survey, respectively. Despite this, the mean amount of debt for respondents is £3,219.57.
Of all respondents, a third (37%) allocate a certain amount of money per month to pay off debt on their credit cards, with the majority paying off between £100 and £300 (37%), which is typically paid off via direct debit (12%).
Four in 10 admitted they wouldn’t be able to clear their credit card debt if their income decreased.
25% use a credit card to spread the cost of living
When asked what the main usage of their credit card is, just under a third (30%) of respondents said they used it predominantly for living expenses and groceries. Other reasons include holidays (20%), retail shopping (20%), socialising (6%), and medical reasons (3%).
The number of respondents using a credit card to pay for living expenses and groceries can be explained by the increasing cost of living – dubbed the cost of living crisis – as a quarter (25%) said they primarily use a credit card to spread the cost of living as they don’t have enough money in their current account to cover monthly expenses. This is most common among those living in Northern Ireland (37%), East Midlands (33%), and Greater London (27%).
Further to this, as a result of the cost of living crisis and the price of fuel skyrocketing, eight respondents in our survey stated that the primary use of their credit card is to pay for fuel.
The regions in the most credit card debt
| Region | No. of credit cards owned | Average credit card repayment per month | % of residents declined on a credit card | Total amount of current credit card debt per person (mean) |
|---|---|---|---|---|
| Greater London | 1.56 | £985 | 25.10% | £3,846 |
| Yorkshire and the Humber | 1.1 | £380 | 21.66% | £3,610 |
| East of England | 1.25 | £559 | 21.26% | £3,571 |
| South West | 1.08 | £699 | 20.96% | £3,516 |
| Northern Ireland | 1.09 | £894 | 14.29% | £3,405 |
| Wales | 1.18 | £661 | 11.24% | £3,273 |
| East Midlands | 1.17 | £772 | 22.63% | £3,257 |
| North West | 1 | £478 | 18.63% | £3,103 |
| North East | 1.33 | £753 | 19.48% | £3,031 |
| West Midlands | 1.29 | £726 | 25.00% | £2,965 |
| South East | 1.17 | £500 | 16.80% | £2,750 |
| Scotland | 1.22 | £264 | 18.30% | £2,229 |
(Source: money.co.uk credit cards survey, July 2022)
Greater London is in the most credit card debt
Card users in Greater London are in the most credit card debt, owing approximately £3,846 per card holder. This is 7% (£236) more than cardholders in Yorkshire and the Humber, in second place, owing £3,610 on average. Credit card debt in Greater London is also a fifth greater than the UK’s national average of £3,213 per card holder.
Scottish cardholders currently owe the least in credit (approximately £2,229 per user). This is £1,617 less than Greater London and 30% below the UK’s national average (£3,213). The South East owe the second least at £2,750 per card holder (14% below average), followed by the West Midlands at £2,695 (7% below average).
Scottish cardholders make the smallest credit card repayments each month
Cardholders in Scotland not only owe the least amount of credit to their card providers but also make the smallest card repayments each month – just £264. This is 30% (£116) less than the repayments made by those in Yorkshire and the Humber who pay the second least amount each month (£380), and over half (58%) of the UK’s average repayment of £639.
The Midlands have the most credit card applications denied
Almost half (48%) of residents in the East and West Midlands have had a credit card application denied. This is followed by Greater London, where over a quarter (25%) of residents have been rejected, and Yorkshire and the Humber, where over one in five (22%) have been denied.
Alternatively, the lowest number of applications rejected in the UK come from Welsh residents, with 1 in 9 rejections (11%). This is 8% below the UK’s national average (20%). Northern Irish card holders follow behind, with just 14% of residents being rejected on a credit card application.
See the results in full in the methodology and sources*.
Credit card statistics - FAQs
Annual percentage rate (APR) is the estimated cost of your borrowing over a year – as a percentage of the money borrowed. For example, if you borrowed £1,000 on a card with 20% APR, you would expect to pay an additional £200 interest on your borrowing throughout the year. This means that cards with a lower APR will charge you less interest on any money borrowed than those with higher rates.
The number of credit cards that are best for you depends on your own personal and financial circumstances. Though holding multiple credit accounts can have a positive impact on your credit rating if managed correctly, but it can be detrimental should you acquire more debt than you can comfortably pay.
You can find expert credit card advice to determine the right path for you by visiting our credit card guides section.
Though paying off credit card debt can feel like a daunting test, there are a few tried and tested methods you can use to ensure you keep on top of your monthly payments. Keeping a journal of your monthly outgoings is a simple but effective way to identify areas where you may be overspending.
Similarly, setting budgets for specific areas of your life allows you to be more mindful of whether your outgoings are sustainable. If you have debts in multiple places, then consolidating your debts into a single loan or on a balance transfer card can simplify your outgoings and make it easier to keep track of your payments.
The average household credit card debt stood at £2,363 in June 2023. This represented a 0.6% increase from the previous month when the figure was £2,350.
As of May 2023, the average limit on a UK credit card stood at £5,565 – up from £5,550 in May 2022.
A secured credit card is a type of credit card in which the customer must provide a cash deposit to acquire the card, with the deposit used as collateral if the customer misses payments. These cards are often sought by people with low credit scores and can be a good way to improve your credit score if managed well.
Credit card glossary
APR
Annual percentage rate (APR) is the estimated cost of your borrowing over a year – as a percentage of the money borrowed.
Balance transfer
Balance transfers are specialised credit cards which allow a cardholder to transfer debt from an existing card onto the balance transfer card. These types of cards often come with 0% interest rates for a limited period, with customers required to pay a minimum monthly fee off the balance.
Credit score
A credit score is a number attributed to your credit report based on various factors, including payment history and current finances. Your credit score can have a significant influence on numerous things, from the amount you can borrow, to the direct debits you can take out and the interest rates you’re offered when borrowing.
Overdraft
Overdrafts are pre-agreed debt limits between a customer and bank, that allows customers to spend more than the amount in their current account. With an overdraft, a sum of money is available to spend even after their account balance has reached £0.
Secured debt
Secured debt refers to any debt where an asset or financial deposit is offered as collateral in the event that a debt cannot be repaid.
Unsecured debt
Unsecured debt refers to credit that is not secured by assets or a financial deposit.
Sources and methodology
https://www.fca.org.uk/publication/financial-lives/financial-lives-survey-2022-key-findings.pdf
https://www.bankofengland.co.uk/statistics/money-and-credit/2023/july-2023
https://www.ibisworld.com/united-kingdom/market-size/credit-card-issuance/
https://themoneycharity.org.uk/media/June-2022-Money-Statistics.pdf
https://www.ukfinance.org.uk/system/files/UK-Payment-Markets-Report-2020-SUMMARY.pdf
https://www.ukfinance.org.uk/system/files/2023-09/Card%20Spending%20Update%20-%20June%202023.pdf
https://www.ukfinance.org.uk/system/files/2023-08/Card%20Spending%20Update%20-%20May%202023.pdf
https://store.mintel.com/report/uk-credit-cards-market-report
https://www.statista.com/statistics/310007/top-uk-brands-across-all-industries-ranked-by-buzz-score/
https://www.ukfinance.org.uk/data-and-research/data/card-spending
https://www.fico.com/en/newsroom/fico-uk-credit-card-market-report-may-2022
https://www.fico.com/en/newsroom/fico-uk-credit-card-market-report-may-2023
https://www.fico.com/en/newsroom/fico-uk-credit-card-market-report-october-2022
https://www.ukfinance.org.uk/system/files/2022-08/UKF%20Payment%20Markets%20Summary%202022.pdf
https://www.bankofengland.co.uk/statistics/money-and-credit/2023/may-2023
https://www.bankofengland.co.uk/statistics/visual-summaries/quoted-household-interest-rates
https://www.prnewswire.com/news-releases/global-credit-card-market-report-2021-301323407.html
https://www.statista.com/forecasts/1149764/credit-card-penetration-forecast-in-the-united-kingdom
https://www.statista.com/statistics/1097179/credit-card-and-debit-card-number-in-the-united-kingdom/
https://www.statista.com/statistics/282689/active-credit-card-accounts-united-kingdom-uk-monthly/
https://www.macrotrends.net/countries/GBR/united-kingdom/population
https://www.ukfinance.org.uk/system/files/2022-05/Card%20Spending%20Update%20-%20February%202022.pdf
https://shiftprocessing.com/credit-card/
https://www.paymentsjournal.com/countries-with-one-or-more-credit-cards-per-person/
https://www.ft.com/content/929a4297-7517-432c-85a3-6616b45e8fe1
https://www.statista.com/statistics/283026/average-credit-card-spend-united-kingdom-uk-monthly/
https://www.fico.com/en/newsroom/fico-uk-credit-card-market-report-january-2022
https://www.ukfinance.org.uk/policy-and-guidance/reports-publications/uk-payment-markets-2020
https://themoneycharity.org.uk/money-statistics/july-2023/
https://www.statista.com/statistics/618115/number-of-visa-credit-cards-worldwide-by-region/
https://www.statista.com/statistics/618137/number-of-mastercard-credit-cards-worldwide-by-region/
https://www.statista.com/forecasts/1218293/united-kingdom-top-payment-methods-ecommercedb
https://www.statista.com/statistics/310007/top-uk-brands-across-all-industries-ranked-by-buzz-score/
https://business.yougov.com/product/brandindex
https://www.experian.co.uk/consumer/credit-score-map-uk/
https://www.equifax.co.uk/resources/what-we-do/your-equifax-credit-report-and-score.html
https://helpandadvice.co.uk/average-credit-score-in-the-uk/
https://www.stepchange.org/Portals/0/assets/pdf/tackling-the-coronavirus-personal-debt-crisis.pdf
https://www.statista.com/statistics/751166/average-credit-card-debt-per-household-uk/
https://inews.co.uk/inews-lifestyle/money/saving-and-banking/credit-card-fraud-rates-uk-high-five-year-consumers-vigilant-online-1491203
https://www.merchantsavvy.co.uk/payment-fraud-statistics/
https://www.ukfinance.org.uk/system/files/Fraud%20The%20Facts%202021-%20FINAL.pdf
https://legaljobs.io/blog/credit-card-fraud-statistics/
https://merchantmachine.co.uk/credit-card-fraud-capitals-of-europe/
https://www.thetimes.co.uk/article/card-details-being-sold-on-dark-web-qf5j7tpcz
https://www.bbc.co.uk/news/technology-54568784
https://www.bbc.co.uk/news/business-57764601
https://www.bbc.co.uk/news/business-57764601
https://www.ukfinance.org.uk/system/files/2022-10/Card%20Spending%20Update%20-%20July%202022.pdf
https://www.bankofengland.co.uk/boeapps/database/Bank-Rate.asp
https://www.fca.org.uk/publication/market-studies/ms14-6-2-ccms-annex-4.pdf
https://themoneycharity.org.uk/money-statistics/august-2023/
https://themoneycharity.org.uk/money-statistics/january-2022/
https://themoneycharity.org.uk/money-statistics/june-2023/
https://www.bankofengland.co.uk/payment-and-settlement/chaps-faster-indicator
https://www.ukfinance.org.uk/system/files/2022-05/Card%20Spending%20Update%20-%20February%202022.pdf
https://nordvpn.com/research-lab/payment-card-details-theft/
https://databank.worldbank.org/source/global-financial-inclusion
More like credit card facts and statistics: 2022
Whether you’re looking to build your credit score or just want the most competitive rates, our personal financial experts have written a whole range of guides to help you manage your money.

How Many Credit Cards Should You Have?
The number of credit cards you should have will depend on how you use them. Here, we weigh up the pros and cons of having multiple credit cards.
Read more
What is a credit record?
A credit score is a record of your financial history, including details of when you have borrowed money and the repayments you have made. Here is what else it shows.
Read more
Credit Card Statistics 2023 - Credit Card Facts and Stats Report
Click here for the latest UK credit card statistics for 2023, including data on users, usage, transactions, providers, credit scores, crime, and more.
Read more
Latest Point-of-Sale Statistics Report 2026 | money.co.uk
Explore recent point-of-sale statistics for 2026 | Exclusive data from Money.co.uk, such as the most common POS systems, various POS market stats, and more.
Read more
About Lucinda O'Brien
Lucinda is a senior finance editor at money.co.uk and helps people to make confident financial decisions so they can make the most of their money.
View Lucinda O'Brien's full biography here or learn more about our editorial policy