UK Savings Account Statistics 2025

This page includes relevant UK Savings Account Statistics, with information on different ways to save money, help to buy statistics, help to save statistics, and child trust fund statistics.
UK savings account statistics show that almost six in ten (57%) adults use a savings account. Given how in the wake of the cost of living crisis, people are putting more time and effort into building up their savings, we felt it was the perfect time to conduct a deep statistical dive into the nature of UK savings accounts in 2023.
We’ve looked into the different methods UK savers use to build up their rainy-day funds, investigated the popularity of help-to-buy and help-to-save ISAs, as well as the prevalence of child trust funds in the UK in 2023.
Top 10 UK savings account statistics
Over four in ten (43%) of UK adults don’t use savings accounts in 2023.
In 2022, just over a fifth (21%) of UK adults had a premium bond savings account, while 19% invested their money in other ways.
Close to a quarter (23%) of UK savers don’t check interest rates before opening an account.
As of February 2022, more than two-thirds (69%) of the UK workforce are members of a pension scheme.
As of February 2023, around 12.6 million people in the UK are on a state pension.
The UK education sector had the most pension scheme contributions in 2021, with over 3.6 million.
As of June 2023, the highest income bracket (earning more than £150,000) recorded an average ISA market value of over £94,000, 55% more than the next income bracket.
There were three times fewer ISA account holders in the £50,000-£99,999 income bracket compared to the £10,000-19,999 one (just over six million versus just over two million).
Under-25s were the most active savers among those with ISA accounts, with more than three-quarters (78%) of account holders in this age group actively saving between 2020 and 2021.
In June 2023, the income band of £10,000-£19,999 had the highest number of ISA holders, over six million.
Different ways of saving money
According to UK savings statistics for 2022, savings accounts are the most popular way for UK adults to save money, with over half (57%) using them. This is followed by ISAs, which are used by 38%.
A report from the Money and Pensions Service report in November 2022 claims that around one in six (17%) UK adults don’t have savings of any kind, while a quarter of adults have less than £100 put away in their savings. More than a third (36%) use their current account to store their savings.
A breakdown of types of savings and investments and the percentage of UK people who have them
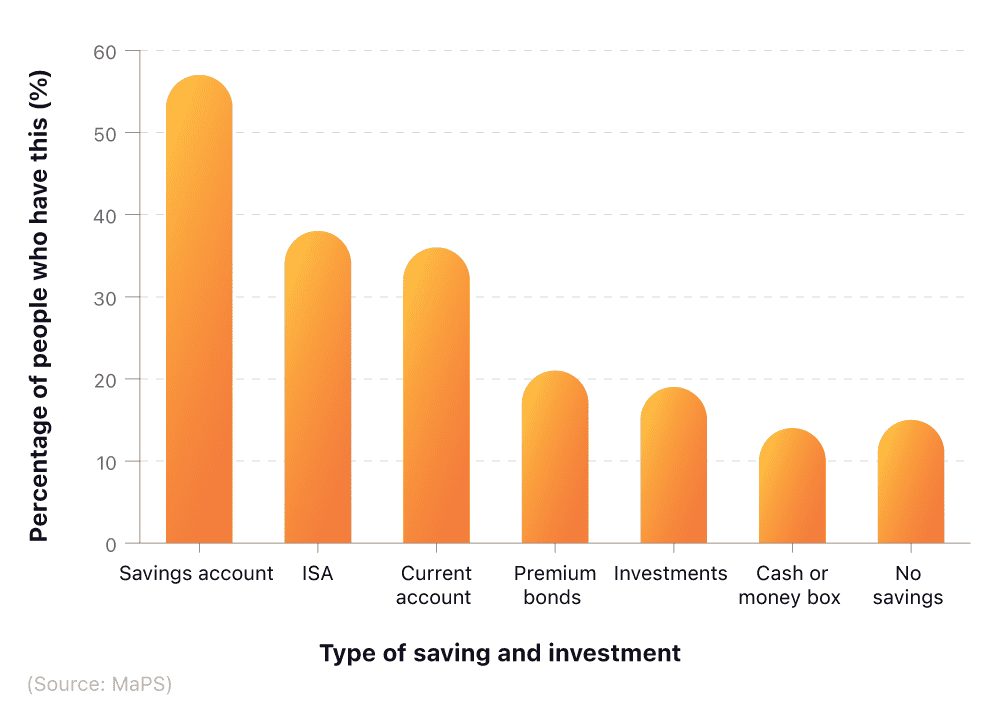
Around one in five UK adults have either a premium bond savings account or choose to invest their money (21% vs 19%, respectively).
Choosing between bonds or a savings account depends on whether you prioritise stable returns and holding to maturity (bonds) or immediate access to your money with lower returns (savings accounts).
When broken down by ethnicity, those from ethnic minorities were much more likely to use credit union savings accounts (11% vs 5%) and savings clubs (8% vs 3%), compared to those from non-ethnic minorities.
A breakdown of monthly deposits from UK households into non-interest-bearing accounts
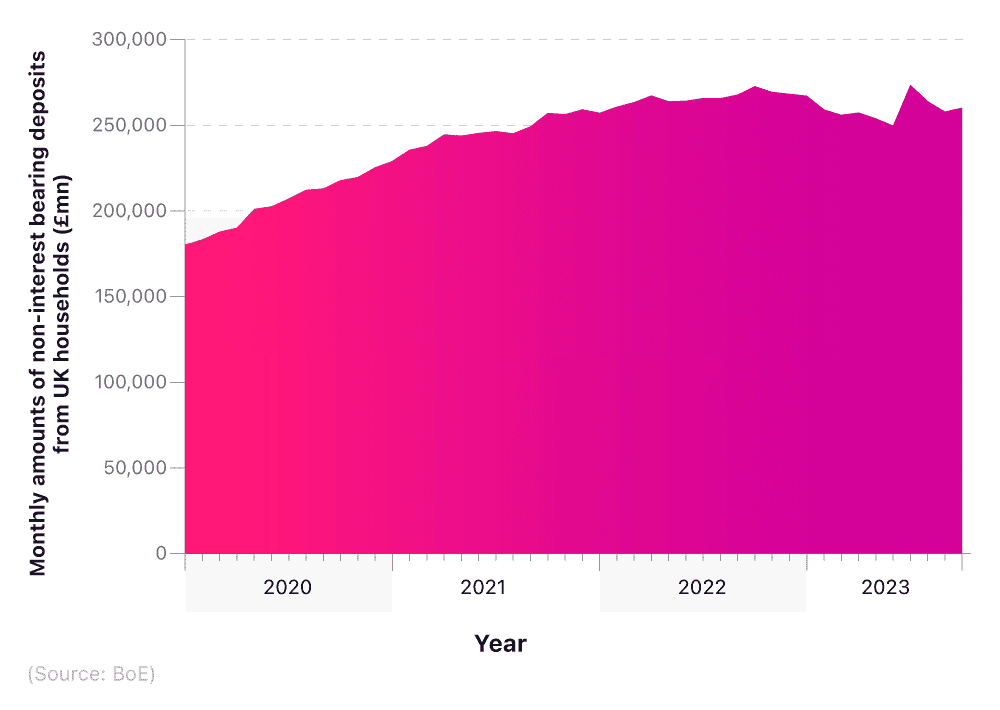
Savings account statistics show that, as of June 2023, there were £2.1 billion in accounts paying no interest.
Research by the BSA found that almost a quarter (23%) of savers don’t check the interest rate before opening an account, with a third (33%) failing to compare interest rates between other accounts.
However, one in three (30%) claimed to have switched accounts that either provide cashback rewards, bonuses, or lower fees.
Over the last decade, the amount of money saved via non-interest-bearing accounts was gradually increasing, from just over £110 billion in January 2012 to around £190 billion at the end of 2017.
The following month, January 2018, this figure dropped by £35 billion to approximately £155 billion, before rising again over the following months.
Throughout 2022, the amount of savings in non-interest accounts grew from £257 billion in January to almost £268 billion in August. Even at a rate of 1.5%, this would translate to over £4 billion of interest that could have been earned if the money had been placed in savings accounts instead. However, in the last year or so, the figure has progressively dropped.
Retirement savings statistics
Choosing the right savings account will very much depend on your circumstances, savings goals, and how accessible you need your money to be in the future. One of the main reasons for opening a savings account is to target a long-term savings goal: retirement.
According to retirement savings statistics from the Pensions Regulator’s Compliance Report, around 10.8 million UK adults had joined an auto-enrolment pension scheme as of November 2022.
Figures collated in February 2022 showed more than two-thirds (69%) of the UK workforce are members of a pension scheme, representing 23.1 million people, meaning that around one in three UK workers (over 10 million employees) weren’t signed up to a pension scheme.
In 2021-22, the Family Resources Survey found that just over half (53%) of working-age adults actively participated in a pension. Participation was not evenly split, however: 72% of employees were contributing compared to just 18% of self-employed individuals.
As of February 2023, 12.6 million people were receiving their State Pension, an increase of 100,000 from the previous year. Of these, approximately 3.2 million were on the New State Pension (NSP), which was introduced in 2016. This was a rise of 690,000 compared to the previous year.
Alongside this, people aged between 18 and 39 may choose a lifetime ISA to supplement their State Pension when they retire. This allows you to save up to £4,000 each tax year and receive a bonus of 25% from the government. The amount you pay in is related to your annual ISA allowance, which stands at £20,000 as of 2023/24. This means that if you pay £4,000 a year into your lifetime ISA, you can still pay £16,000 a year into other ISA accounts.
Comparing pension accounts will help find the product that is right for you and your circumstances. Whether that is an income drawdown pension, self-invested personal pension (SIPPS), or something more bespoke like a personal pension plan, the market is full of exciting opportunities with competitive rates.
Even if you already have one set up, transferring your pension to a new provider can help save on fees, while simultaneously offering more control of your money.
Pension contributions by employers and employees
According to our savings report, there were over 8.2 million defined pension contributions in 2021, accounting for almost 29% of the UK workforce. By contrast, there were a little more than eight million from employers, constituting 28% of UK companies.
A breakdown of pension contributions between UK employers and employees
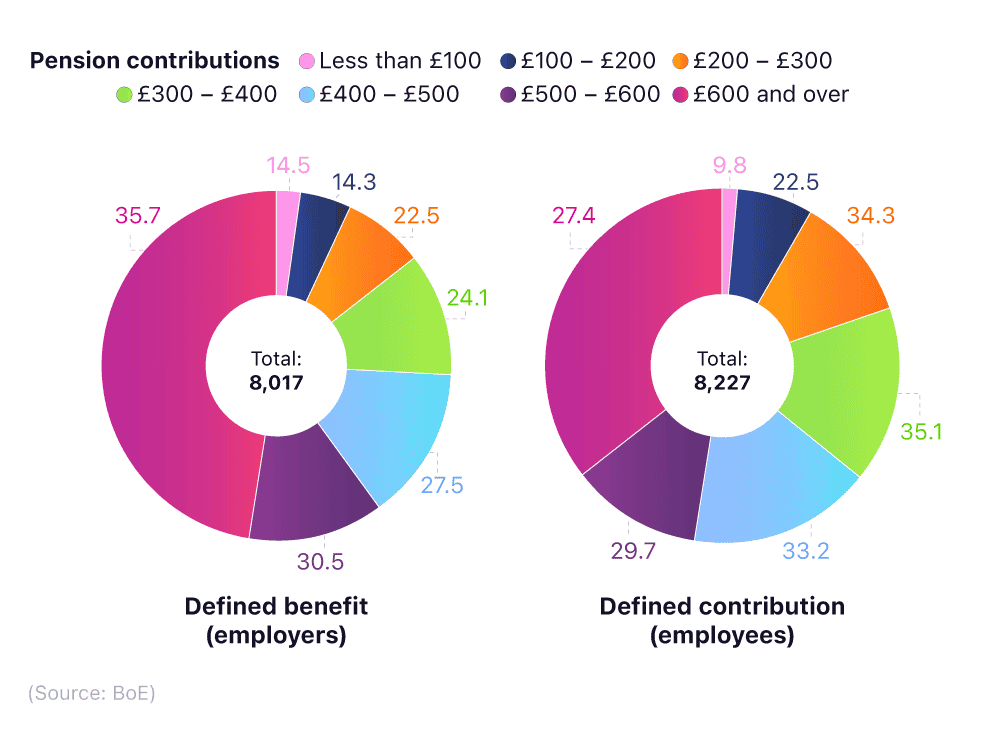
Nearly 3.8 million employers contribute £600 or more, compared to around 2.9 million employees (representing 36% and 27% respectively) – the most common amount contributed for each group.
Generally, as the contributed amount increases, so does the number of employers and employees. The exception to this is for pension contributions of £500-£600, where the respective numbers drop to just over one million for employers and 986,000 for employees.
Type of pension provision
Between 1997 to 2021, the percentage of people with a workplace pension has gradually increased. At the start of the millennia, more than half (55.2%) of employees had a workplace pension. This figure steadily dipped, reaching a low in 2012, when the respective figure was just 46.5%.
This then jumped by 13 percentage points in the space of just two years, with 59.3% having a workplace pension in 2014. As of 2021, this figure was close to 80%.
A breakdown of the proportion of employees with workplace pensions by type of pension
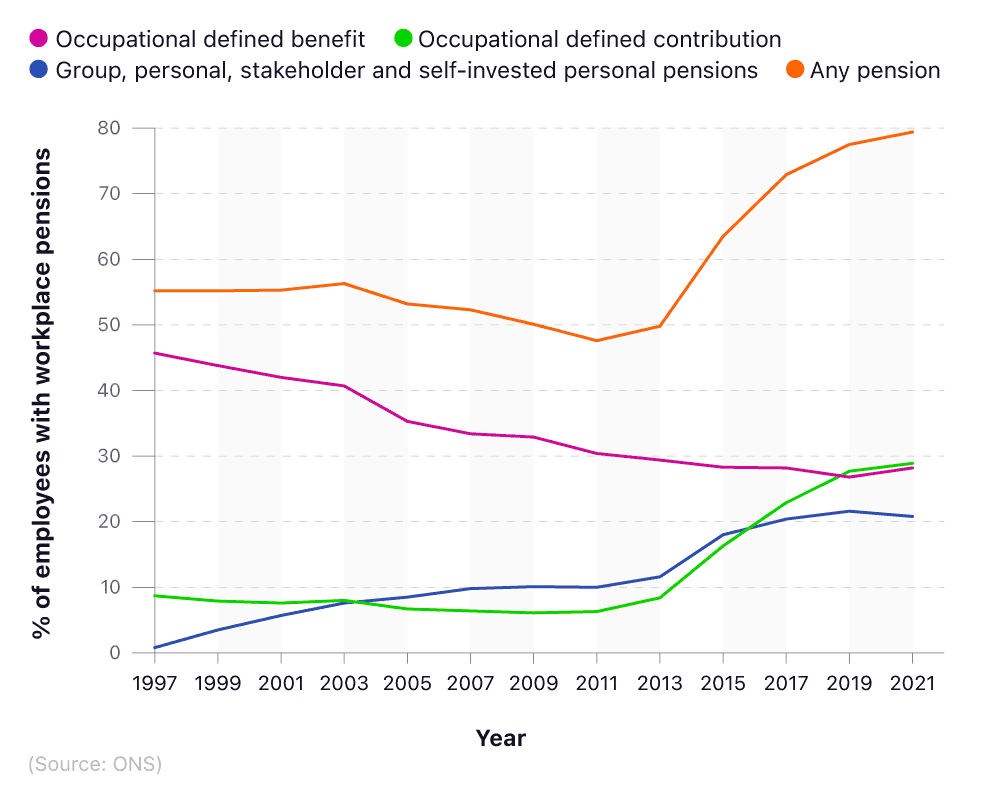
In 1997, occupational-defined benefit pensions were by far the most popular type of pension with 45.7% share of employees having one. However, between 1997 and 2013, this declined by 16.3 percentage points to 29.4%.
In 2019, the occupational-defined contribution pensions took over the top spot. Between 2010 and 2019, this type of pension climbed in popularity – 6.4% of employees had this type of pension at the start of the decade with 27.7% holding one nine years later.
In 1997, group personal, stakeholder and self-invested personal pensions were almost unheard of with only 0.8% of employees having this type of pension scheme. It has since increased dramatically, with 20.8% of employees having one in 2021.
A breakdown of full-time employees with workplace pensions by gross weekly earnings
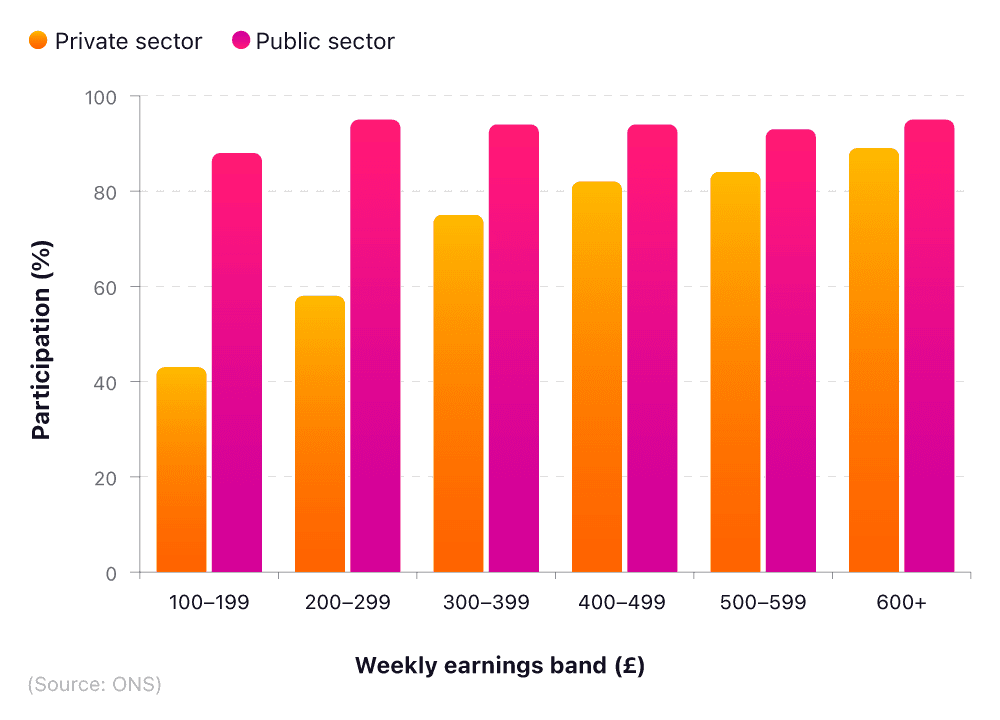
UK pension statistics suggest the more someone earns per week, the more likely they are to have a workplace pension. Workers in the private sector, who earn between £100 to £199 per week, are considerably less likely to have a workplace pension than those on a higher salary. Just 42.7% of workers in the lowest bracket have workplace pensions, compared to more than double (89.4%) in the highest.
In addition to this, the data shows that workers in the public sector are far more likely to have a workplace pension than those in the private sector. Over 95% of workers in the public sector on £200 to £299 have a workplace pension. This is six percentage points more than the highest percentage for workers in the private sector, which is 89.4% and applies to those earning more than £600 per week.
A breakdown of the proportion of UK employees with pension provision by age
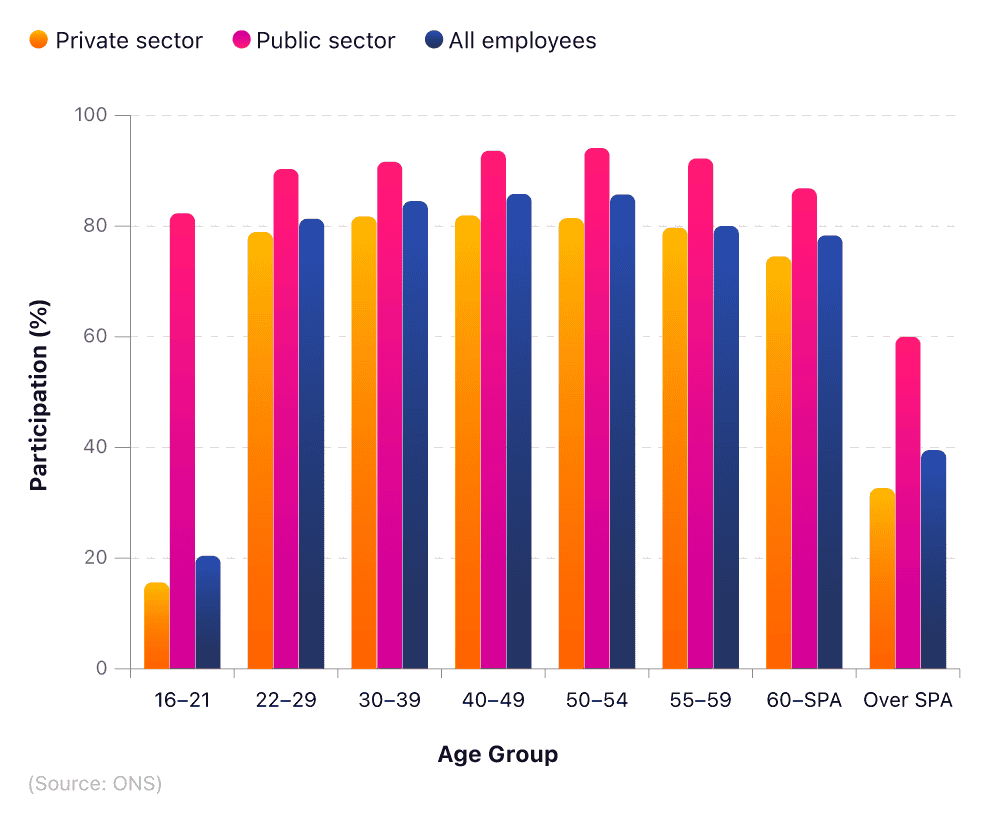
The age group with the highest proportion of UK employees with pension provision is the 40-49 bracket. Within this age group, more than eight in 10 (81.9%) private sector employees have a pension, with 93.6% for public sector employees.
Between the ages of 22 and 60, the proportion of employees with a pension provision remains stable. Around 81.3% of employees aged 22 to 29 have a pension provision, just 5% per cent less than the 40-49 age bracket with the highest proportion of pension provisions at 85.7% for all employees.
A breakdown of UK employees who have no workplace pension provision in place and their average monthly savings
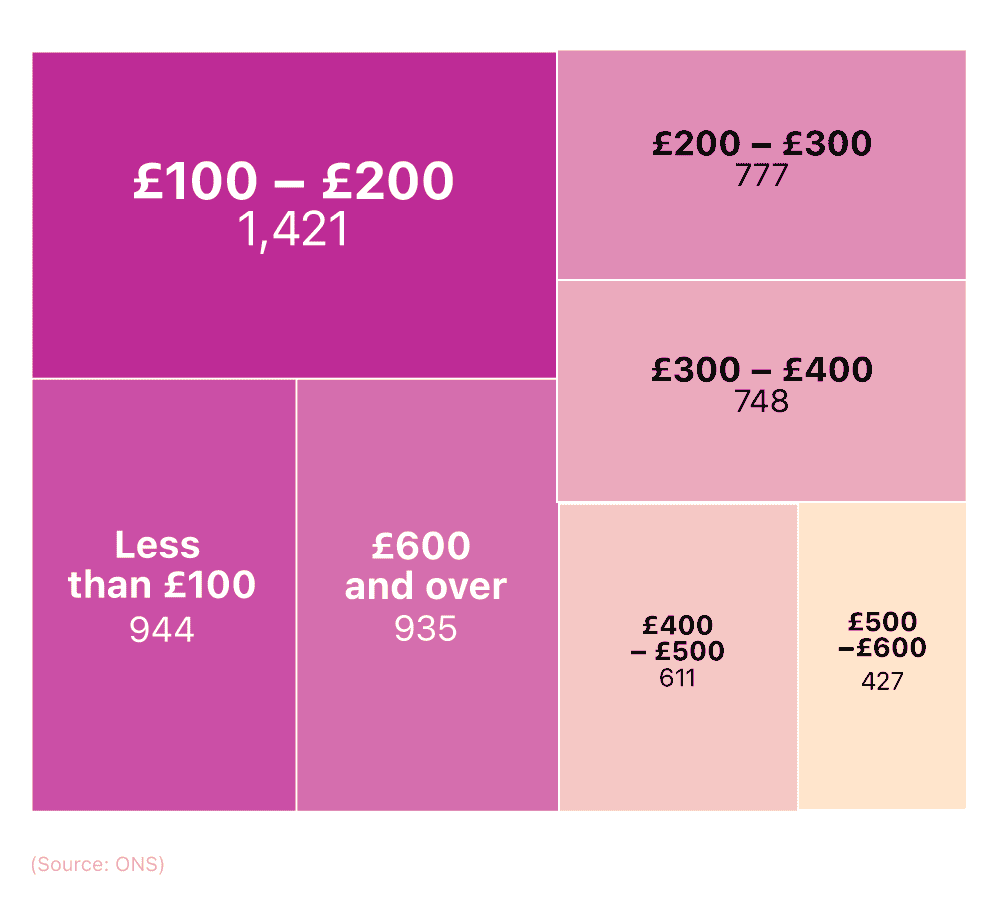
UK savings account statistics indicate that, as of 2021, one in five UK employees has no official employer pension provision in place. This represents over 5.8 million workers or 20% of the UK workforce.
Of these, less than a quarter (24%) are putting between £100-£200 a month into a savings account with retirement in mind, followed by 16% each for contributions of less than £100 and £600 or more.
Pension scheme contribution by industry
When savings stats were broken down by industry, there were more pension scheme contributions by the education sector in 2021 than any other.
Last year, there were more than 3.6 million pension schemes in place for those working in education, followed by almost 3.4 million for human health and social work. Those working in wholesale and retail trade (specifically the motor industry), as well as the manufacturing sector, were also well represented with 2.7 million and two million pension schemes, respectively.
A breakdown of the estimated total pension schemes by industry (2021)
| Industry type and description | Estimated total pension schemes (2021) |
|---|---|
| Education | 3,615,000 |
| Human health and social work activities | 3,359,000 |
| Wholesale and retail trade; repair of motor vehicles and motorcycles | 2,734,000 |
| Manufacturing | 2,044,000 |
| Professional, scientific, and technical activities | 1,546,000 |
| Public administration and defence; compulsory social security | 1,516,000 |
| Transportation and storage | 916,000 |
| Administrative and support service activities | 897,000 |
| Financial and insurance activities | 878,000 |
| Information and communication | 772,000 |
| Construction | 752,000 |
| Accommodation and food service activities | 581,000 |
| Real estate activities | 298,000 |
| Arts, entertainment, and recreation | 282,000 |
| Water supply; sewerage, waste management, and remediation activities | 142,000 |
| Electricity, gas, steam, and air conditioning supply | 140,000 |
(Source: ONS)
The least represented sectors for the total number of pension schemes were those that supplied facilities, such as water, sewage, and waste, as well as electricity, gas, steam, and air conditioning. These respective figures were around 140,000.
Average employee pension contribution by industry (exclusive data)
Our pensions and retirement savings report shows that, as of 2021, the sector that contributed the most to workers’ pensions was public administration and defence, at just over 20%, followed by education at around 15%-20%.
Those working in an industry that supplies electricity, gas, steam, and air conditioning could expect an average employee contribution of between 10%-12% in 2021. However, this is a significant drop since 2016, when they could have expected between 12%-15%.
A breakdown of average employee pension contribution between 2016 and 2021
| Industry | 2016 | 2017 | 2018 | 2019 | 2020 | 2021 |
|---|---|---|---|---|---|---|
| Manufacturing | 4 to <8% | 4 to <8% | 4 to <8% | 4 to <8% | 4 to <8% | 4 to <8% |
| Electricity, gas, steam and air conditioning supply | 12 to <15% | 10 to <12% | 10 to <12% | 10 to <12% | 10 to <12% | 10 to <12% |
| Water supply; sewerage, waste management and remediation activities | 8 to <10% | 8 to <10% | 8 to <10% | 8 to <10% | 8 to <10% | 8 to <10% |
| Construction | 4 to <8% | 4 to <8% | <4% | 4 to <8% | 4 to <8% | 4 to <8% |
| Wholesale and retail trade; repair of motor vehicles and motorcycles | 4 to <8% | 4 to <8% | 4 to <8% | 4 to <8% | 4 to <8% | 4 to <8% |
| Transportation and storage | 8 to <10% | 8 to <10% | 4 to <8% | 4 to <8% | 8 to <10% | 8 to <10% |
| Accommodation and food service activities | <4% | <4% | <4% | <4% | <4% | <4% |
| Information and communication | 4 to <8% | 4 to <8% | 4 to <8% | 4 to <8% | 4 to <8% | 4 to <8% |
| Financial and insurance activities | 8 to <10% | 8 to <10% | 8 to <10% | 8 to <10% | 8 to <10% | 10 to <12% |
| Real estate activities | 8 to <10% | 8 to <10% | 4 to <8% | 4 to <8% | 4 to <8% | 8 to <10% |
| Professional, scientific and technical activities | 4 to <8% | 4 to <8% | 4 to <8% | 4 to <8% | 4 to <8% | 4 to <8% |
| Administrative and support service activities | 4 to <8% | <4% | <4% | 4 to <8% | 4 to <8% | 4 to <8% |
| Public administration and defence; compulsory social security | 15 to <20% | 15 to <20% | 15 to <20% | 15 to <20% | 15 to <20% | >20% |
| Education | 15 to <20% | 15 to <20% | 15 to <20% | 15 to <20% | 15 to <20% | 15 to <20% |
| Human health and social work activities | 10 to <12% | 10 to <12% | 10 to <12% | 10 to <12% | 10 to <12% | 10 to <12% |
| Arts, entertainment and recreation | 8 to <10% | 4 to <8% | 4 to <8% | 4 to <8% | 4 to <8% | 4 to <8% |
(Source: money.co.uk via ONS)
The vast majority of sectors have seen stagnation in their employer pension contributions over the past five years. Notably, those in public administration and defence have seen a rise between 2020 and 2021, from 15%-20% to over 20% (the largest increase of any sector). In this same period, one other sector also witnessed an increase (financial and insurance services), which rose from 8%-10% to 10%-12%.
At the other end of the scale, the arts, entertainment, and recreation industry witnessed a decrease between 2016 and 2017, from 8%-10%, down to 4%-8% (a level that has remained ever since).
On average, the smallest contributions came from the accommodation and food service sector, at below 4%. This has historically been low, with the sector recording scores of less than 4% since 2016.
A breakdown of average employee pension contribution between 2022 and 2026
| Industry | 2022 | 2023 | 2024 | 2025 | 2026 |
|---|---|---|---|---|---|
| Manufacturing | 4 to <8 % | 4 to <8 % | 4 to <8% | 4 to <8% | 4 to <8% |
| Electricity, gas, steam and air conditioning supply | 10 to <12% | 10 to <12% | 10 to <12% | 10 to <12% | 10 to <12% |
| Water supply; sewerage, waste management and remediation activities | 8 to <10% | 8 to <10% | 8 to <10% | 8 to <10% | 8 to <10% |
| Construction | 4 to <8 % | <4%* | <4%* | <4%* | <4%* |
| Wholesale and retail trade; repair of motor vehicles and motorcycles | 4 to <8% | 4 to <8% | 4 to <8% | 4 to <8% | <4%* |
| Transportation and storage | 4 to <8%* | 4 to <8%* | 4 to <8%* | 4 to <8%* | 4 to <8%* |
| Accommodation and food service activities | <4% | <4% | <4% | <4% | < 4% |
| Information and communication | 4 to <8% | 4 to <8% | 4 to <8% | 4 to <8% | 4 to <8% |
| Financial and insurance activities | 8 to <10%* | 8 to <10%* | 8 to <10%* | 8 to <10%* | 8 to <10%* |
| Real estate activities | 4 to <8%* | 4 to <8%* | 4 to <8%* | 4 to <8%* | 4 to <8%* |
| Professional, scientific and technical activities | 4 to <8% | 4 to <8% | 4 to <8% | 4 to <8% | 4 to <8% |
| Administrative and support service activities | <4%* | <4%* | <4%* | <4%* | <4%* |
| Public administration and defence; compulsory social security | >20% | >20% | >20% | >20% | >20% |
| Education | 15 to <20% | 15 to <20% | 15 to <20% | 15 to <20% | 15 to <20% |
| Human health and social work activities | 10 to <12% | 10 to <12% | 10 to <12% | 10 to <12% | 10 to <12% |
| Arts, entertainment and recreation | 4 to <8% | 4 to <8% | 4 to <8% | 4 to <8% | 4 to <8% |
(Source: money.co.uk via ONS) | Note: These figures are forecasts. Those with an asterisk (*) denote a change from the current (2021) contribution bracket.
Our savings stats show that, in 2026, the sectors expecting to see the largest employee pension contributions are public administration and defence (20%+) and education (15-20%). Both will retain their places as the largest contributing sectors to employee state pensions from previous years.
By 2026, those working in wholesale and retail trade can expect their employer pension contributions to drop from between 4%-8% to under 4%.
Some industries are expected to have a sustained decrease in their employer pension contributions between 2022-26. For example, administrative and support services should see a decrease from 4-8% in 2021 to less than 4% from 2022 onwards. Construction should see an identical trend from 2023 onwards.
On the other hand, contributions from companies in the real estate sector, as well as transport and storage, are predicted to go from 8-10% in 2021, to 4-8% from 2022-26. The corresponding figures for financial and insurance activities are expected to go from 10-12% in 2021, to 8-10% from 2022 onwards.
Accommodation and food services will remain the smallest pension contributor into 2026, at less than 4% on average—a trend that has remained constant since 2016.
ISA statistics
Choosing an ISA account allows you to earn interest without paying any income tax, provided you don’t pay in more than your tax allowance for the year. For the 2023/24 tax year, this stands at £20,000.
Number of ISA subscriptions by year
According to UK government ISA statistics, almost 11.8 million adults subscribed to ISAs between 2021-22. These numbers represent a decrease from 2020-21 when over 12 million new accounts were opened.
The figures show a slow but steady downward trend in subscriptions for ISA accounts since 2010-11, when the figure peaked with over 15 million accounts being opened. A notable exception to this occurred in 2019-20 when there was a two million year-on-year increase in the number of subscriptions. However, this was followed by another fall in 2020-21.
A breakdown of ISA subscriptions in the UK between 2010 and 2021
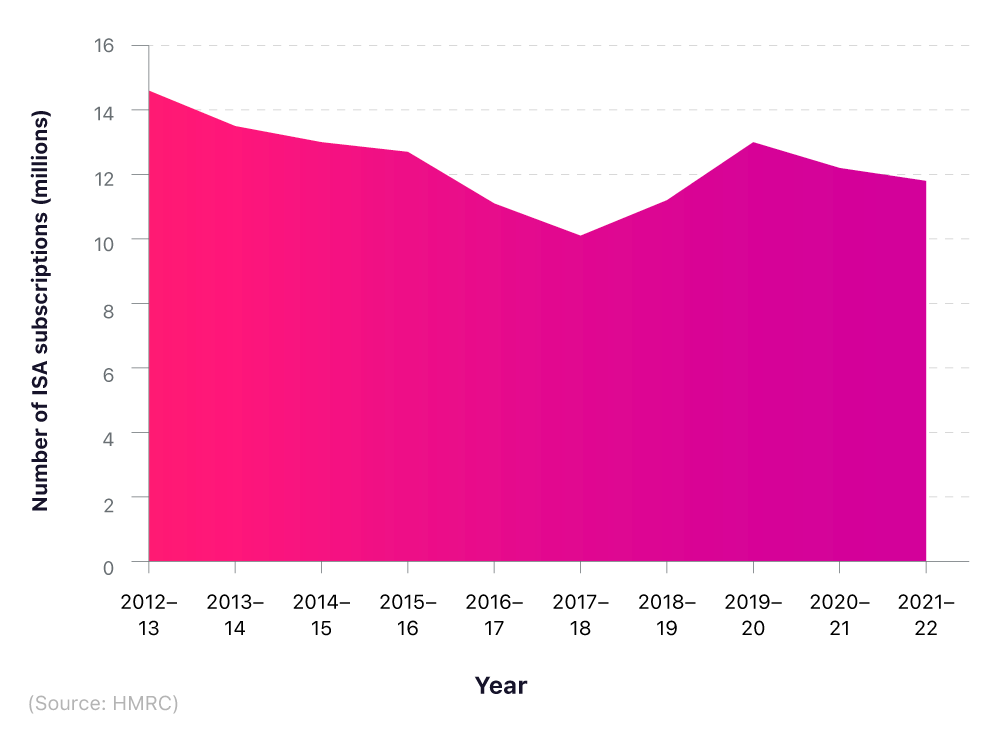
These savings facts suggest that the Covid pandemic may have halted a potential upward trajectory in saving figures.
Just under four million of the adult ISAs opened in 2021-2022 were stocks and shares ISA accounts. This represented an increase of over 345,000 from the previous year. Contrastingly, the rate of standard cash ISA subscriptions dropped by over 920,000 during the same period. This has been a trend over the last three years, with adult stocks and shares ISAs growing in popularity while interest in standard cash ISAs has fallen.
Market value of ISA accounts
The market value for all adult ISA and PEP funds has been growing over the last decade, reaching an all-time high of over £741 billion in 2021-2022. Recent ISA statistics included in this savings report indicate that this is a rise of £55 billion over the previous year.
This rise was primarily caused by an 18% increase in the market value of funds held in stocks and shares ISAs, which rose from around £41 billion to over £48.6 billion in the same year.
A breakdown of the market value for ISA accounts and PEP funds in the UK between 2011 and 2021
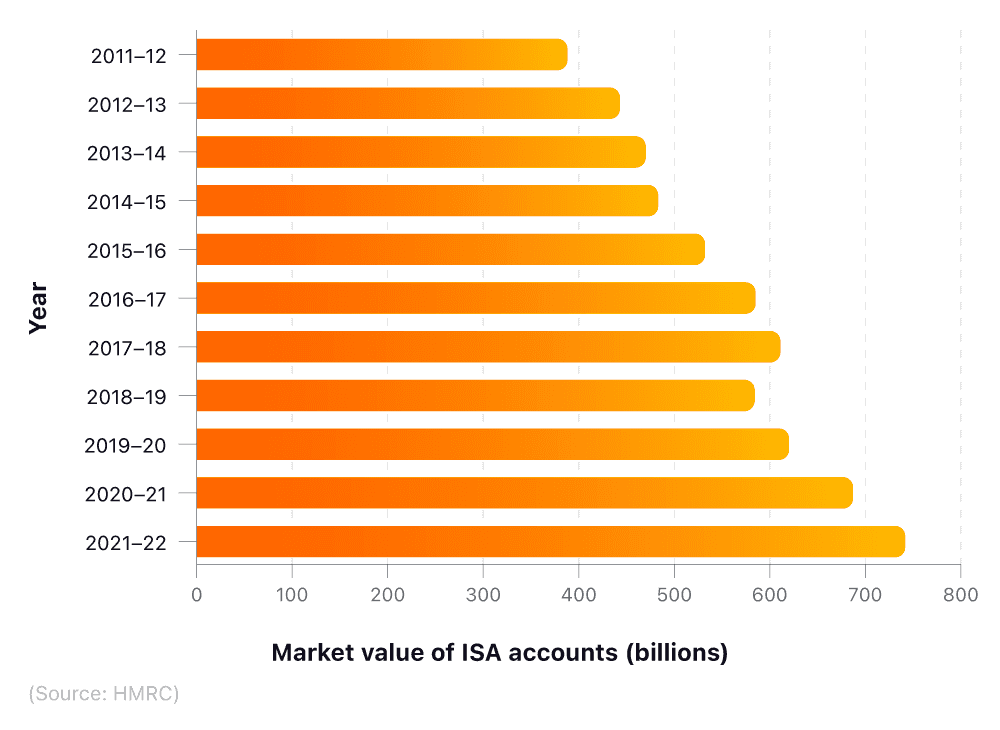
These figures are indicative of a steady upward trajectory over the last decade, which has seen the overall market value of ISAs increase by over £300 billion since 2010-2011.
If you want more information on the UK savings market as a whole then visit our UK saving market trends page for all the latest insight.
ISA value by income
Our savings report analysed adult ISA holders in 2021-2022 based on their annual income, by looking at the quantity of ISA holders in each income band and assessing the median ISA market value for each group.
UK savings account statistics show a strong correlation between higher income groups and increased ISA value. The lowest income band (£0-£4,999) recorded the lowest average ISA market value of around £15,000, with each subsequent band rising in value before peaking with account holders earning £150,000 or more. With a median value of over £94,000, this group were found to have an average of around 53% more ISA savings than the next highest income band (£100,000-£149,000).
A breakdown of the ISA market in the UK by number of ISA account holders and average ISA market value
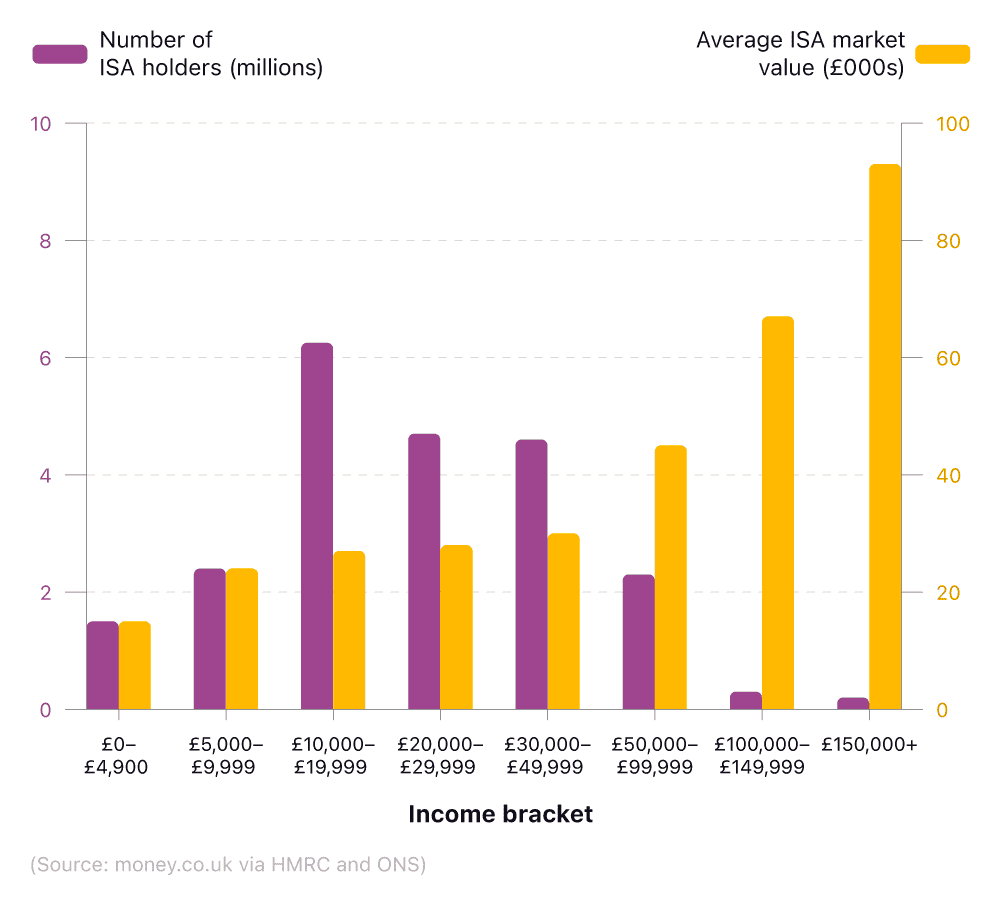
With over six million accounts, the income band of £10,000-£19,999 had the highest number of ISA holders in the 2020-21 tax year. There were just over two million ISA holders among those earning £50,000 to £99,999, with the figure dipping further to around 0.3 million account holders for those earning £100,000-£149,000.
ISA holders by age
Under-25s were responsible both for the lowest quantity and lowest value of ISA accounts, with 1.8 million ISA holders in 2023 and an average market value of £6,398.
According to the government’s 2021 ISA statistics, subscription figures were broadly similar for all age groups between 25 and 64 (3.5–3.8 million) before rising sharply to 6.2 million for the oldest age group (65+).
A breakdown of ISA account holders in the UK by age, the number of accounts, and average market value
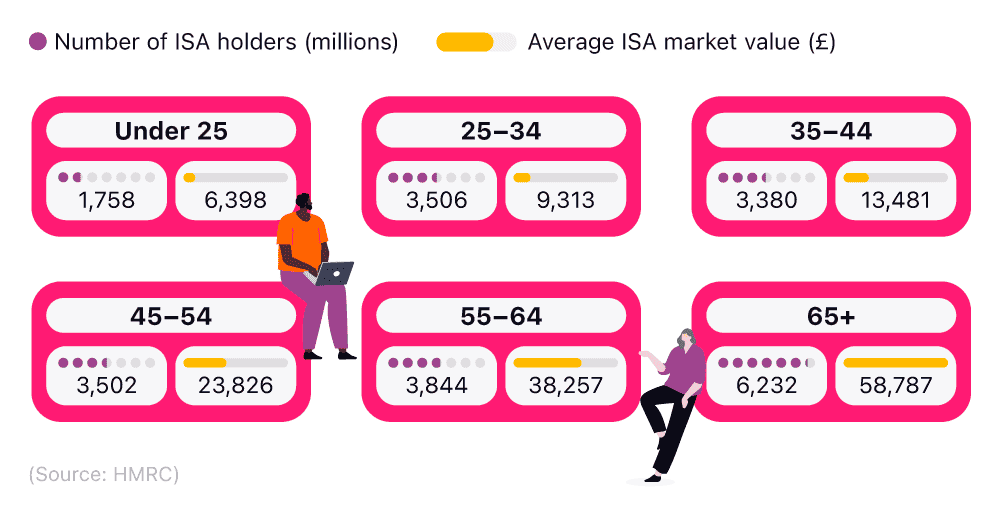
Despite having the highest number of ISA holders and the most savings, almost seven in 10 (69%) account holders aged 65+ were found not to be active savers in 2020-2021.
Conversely, while ISA statistics show that under 25s have the least savings in their accounts, 78% of account holders in this age group were found to be active savers during this period.
Find out how you can earn interest tax-free with a cash ISA account for the over-60s
ISA holders by age and gender
The ISA statistics by age and gender from our savings report show that in every age group, women have more ISA accounts than men. With approximately 11.5 million accounts in total, women have around 0.7 million more accounts than their male counterparts.
The greatest differences can be found in the older age categories, with women aged 55-64 and 65+ having approximately 450,000 ISA accounts than men of the same age.
A breakdown of ISA accounts in the UK by age and gender, based on the average market value and number of ISA account holders
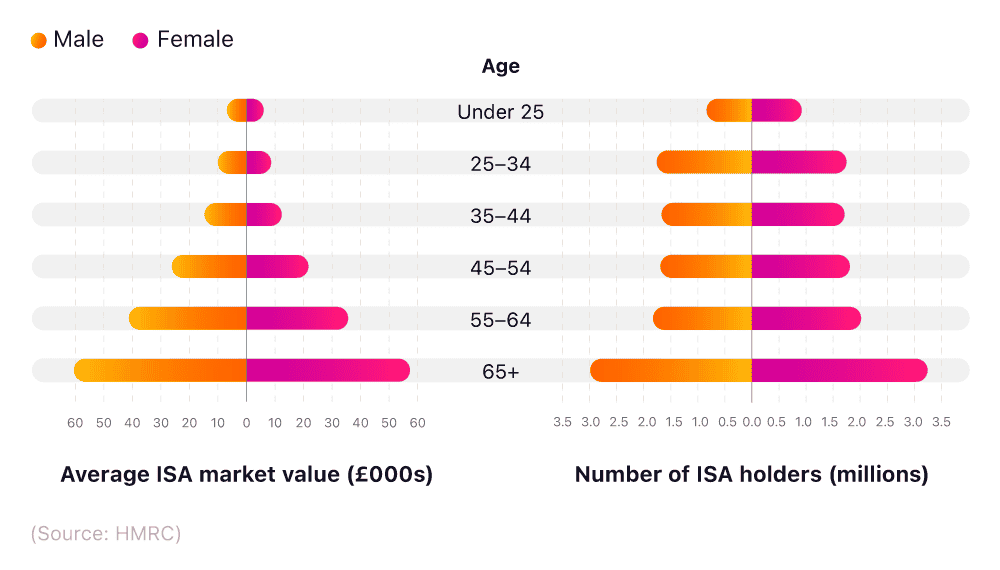
Though women have more accounts in all age groups, the trajectory is largely the same across both genders, with the lowest number of subscribers occurring below the age of 25 and the highest age group being 65+.
The higher uptake of ISA accounts in women, however, isn’t matched by an increased market value. In every age group, men were found to have a higher average ISA value than women, with the largest gap being more than £6,300 in the 55-64 age category.
This indicates that while women are more likely to open ISA accounts, it’s men who are the biggest savers.
ISA holders in the UK by region
The figures also show that the South West and South East had the highest percentage of ISA account holders in the UK, with 46% of residents in each region being subscribers. Just 39% of those in London had an account, making it the joint lowest scorer in percentage terms of all the English regions, alongside the North East. Northern Ireland and Scotland had the lowest overall percentages, with 32% and 37%, respectively.
A breakdown of ISA holders in the UK by region
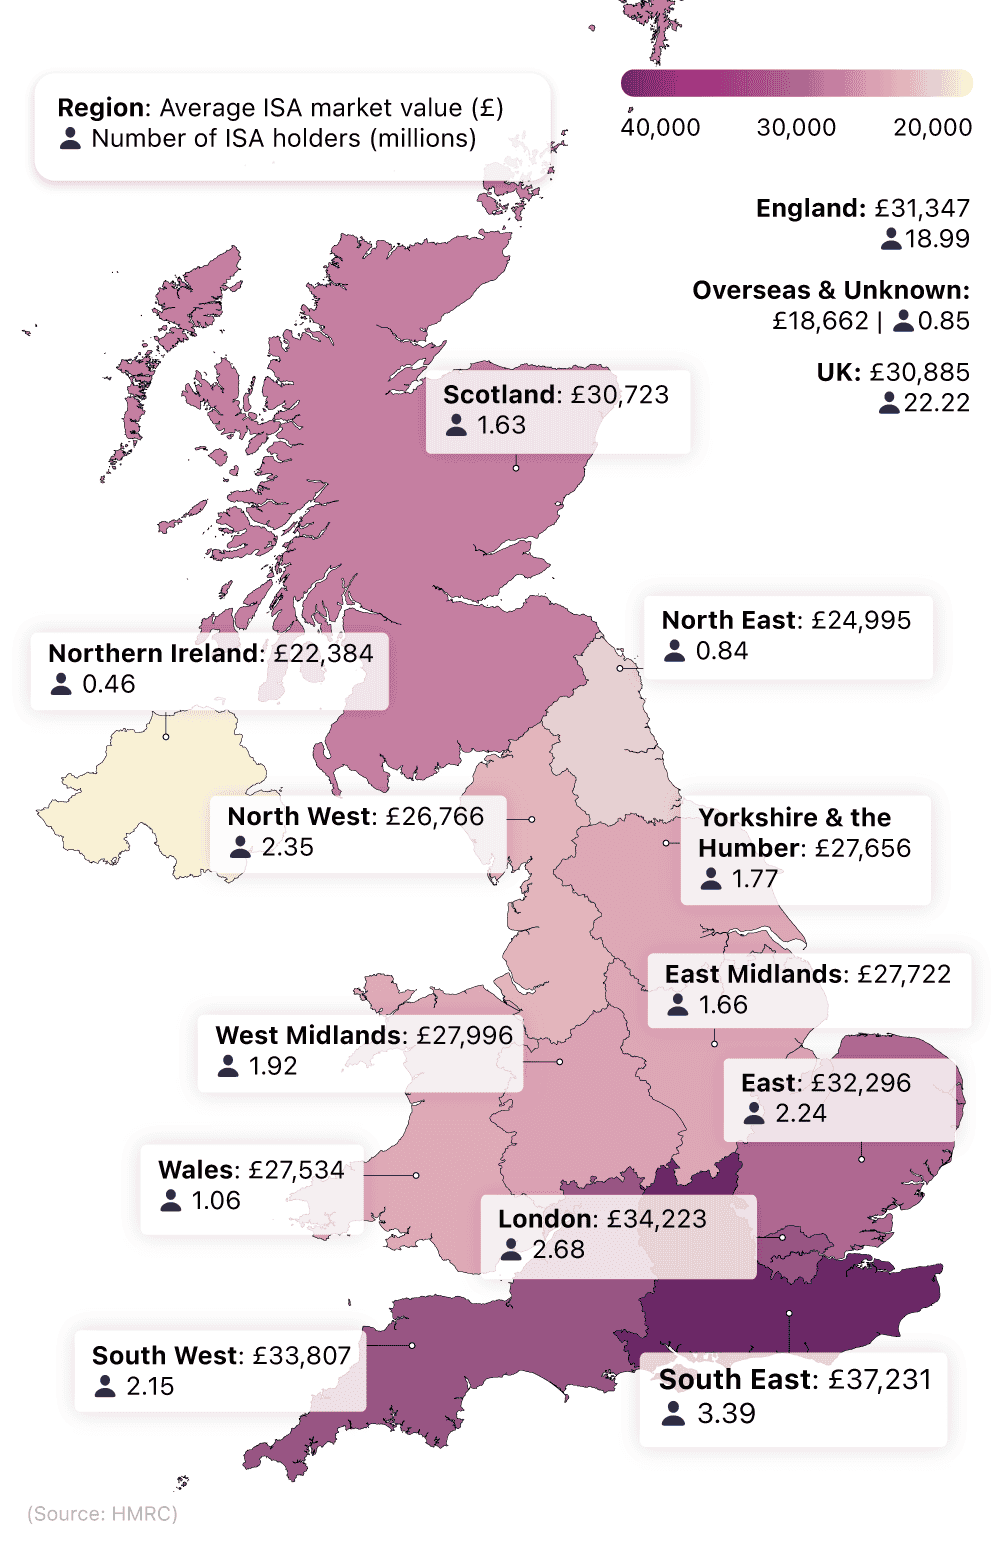
Despite London’s comparatively low uptake, the capital was found to have one of the highest average ISA market values across the country (£34,223), second only to the South East (£37,231).
Contrastingly, Northern Ireland’s low ISA uptake was matched by its low average market value, with the country’s median ISA being worth just £22,384, putting it firmly at the bottom of the table. Accounts in Wales – the second-to-bottom region – had an average of £5,000 more.
Lifetime ISA statistics
Lifetime ISA (LISA) statistics for withdrawals for house purchases have accelerated rapidly year-on-year. The low number of 50 LISA withdrawals for 2017-18 can be attributed to the fact that these accounts didn’t become available until April 2017. Therefore, not enough time had accumulated for most people to save enough cash, to withdraw any for a house purchase.
Number of individuals making lifetime ISA withdrawals for a house purchase
The rise of over 50% between 2020-21 and 2021-22 suggests that these figures are likely to accelerate further in the coming years, as new accounts are opened and existing accounts accumulate further savings.
A breakdown of individuals making lifetime ISA withdrawals to purchase a house
| Year | Number of withdrawals |
|---|---|
| 2017-18 | 50 |
| 2018-19 | 8,200 |
| 2019-2020 | 22,350 |
| 2020-21 | 34,100 |
| 2021-2022 | 50,300 |
| 2022-2023 | 56,100 |
(Source: HMRC)
However, the rate of increase slowed in 2022-23 to just 11.5% year on year with 56,100 individuals making Lifetime ISA withdrawals.
Value of withdrawals for a house purchase
The average value of withdrawals has risen with each passing year since 2017-18. The biggest increase occurred between 2019-2020 and 2020-2021 when the average withdrawal increased by nearly £1,000.
A breakdown of the average values of withdrawals by year
| Year | Average value of withdrawals |
|---|---|
| 2017-18 | £8,526 |
| 2018-19 | £9,686 |
| 2019-20 | £11,208 |
| 2020-21 | £12,402 |
| 2021-22 | £13,090 |
| 2022-23 | £13,877 |
(Source: HMRC),
As of 2023, the average value of withdrawals for a house purchase stood at £13,877 – a 62% increase since 2017.
Child trust fund statistics
Saving for your children’s future is an important part of financial planning. Choosing a children’s investment ISA means you can open an account for your child with as little as £1. From the age of seven, they can start to manage their account, and at the age of 18, the account can be transferred into their name.
Average market value of child trust funds
Government child trust fund statistics as of April 2022 show that there are approximately 5.67 million child trust fund accounts in the UK, with stakeholder accounts making up around 70% of this figure. However, this type of account has the lowest average market value (£1,872) – £624 less on average than non-stakeholder ones, the next most popular type.
A breakdown of the number of child trust fund accounts and their subscription value
| Account type | Number of accounts (millions) | Average Subscription (£) |
|---|---|---|
| Stakeholder | 4.02 | 1,872 |
| Non-stakeholder | 0.88 | 2,496 |
| Matured (claimed) | 0.34 | 2,497 |
| Matured (continuing) | 0.43 | 2,203 |
| All types | 5.67 | 2,031 |
(Source: HMRC)
Matured accounts had the highest average market value (£2,497), yet accounted for around 7.5% of the overall total number of accounts.
Around 428,000 people have opted for a continuing mature account, as opposed to 338,000 for claimed mature accounts. However, despite having 90,000 fewer accounts, the latter has, on average, just under £300 more in terms of market value.
Child trust fund subscribers by subscription value
UK Government data from 2021-22 shows that the subscription volume of child trust fund accounts generally decreased as the price increased, barring a small uptick in demand for subscriptions of £25,000 or more.
A breakdown of UK child trust fund subscriptions by number of accounts and average subscription value
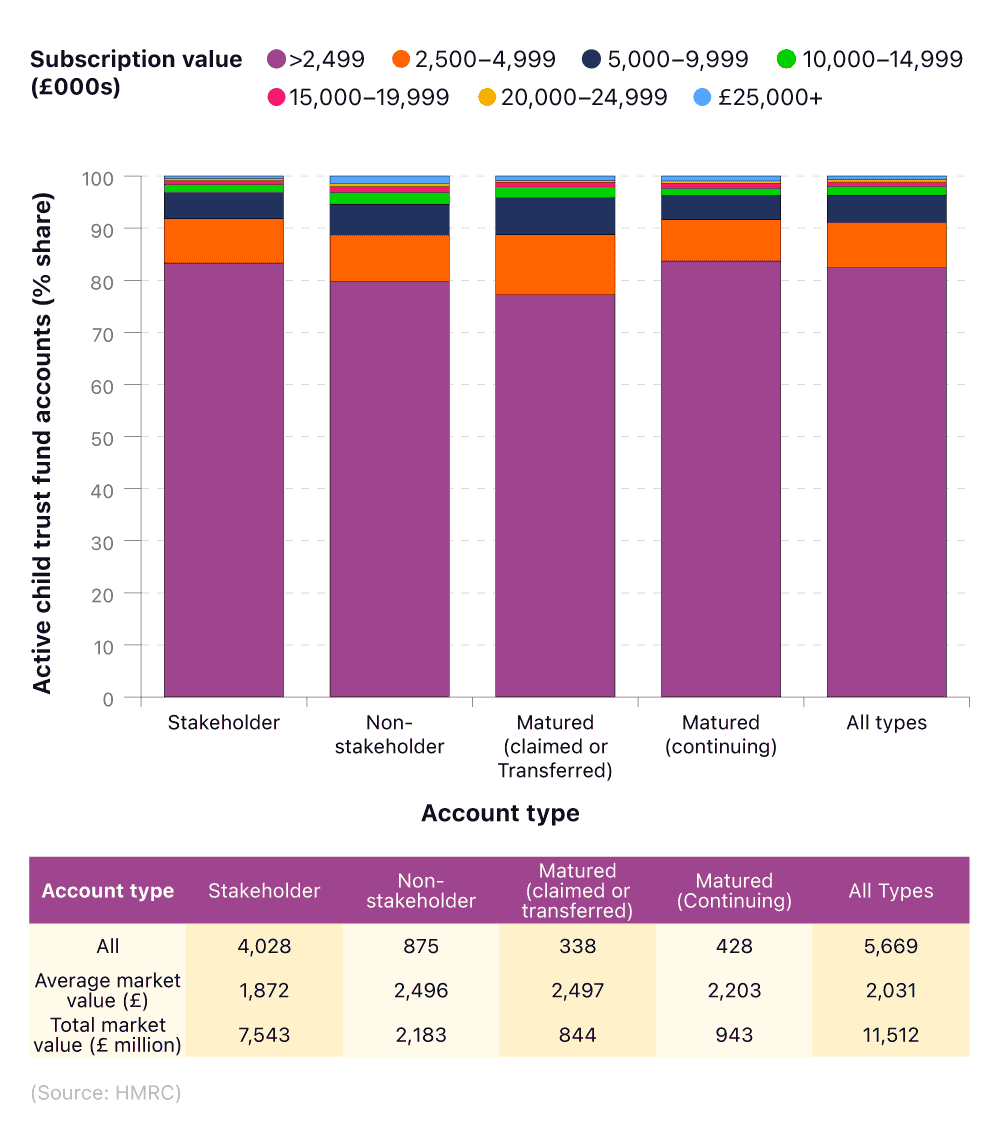
For all account types, the lowest value subscription category of £1-249 was the most popular, with 4.67 million people paying within this range.
The vast majority of accounts with subscriptions over £10,000 were stakeholder accounts (62%), with only 16,000 mature accounts within this subscription range.
Junior ISA saving account statistics
Choosing a junior ISA can help build up a pot of money (up to £9,000 in the 2021/22 tax year), ready for a child’s 18th birthday. As of 2022, the best junior cash ISAs will offer anything up to 3.50% AER, however, if a child’s account earns more than £100 in interest, the parent must pay tax on those savings.
UK Government data shows a continued rise in junior ISA account subscriptions throughout the last decade. The biggest annual increase occurred between the years 2015-16 and 2016-17 when account subscriptions accelerated by over 12%.
A breakdown of junior ISA savings accounts in the UK between 2013 and 2021
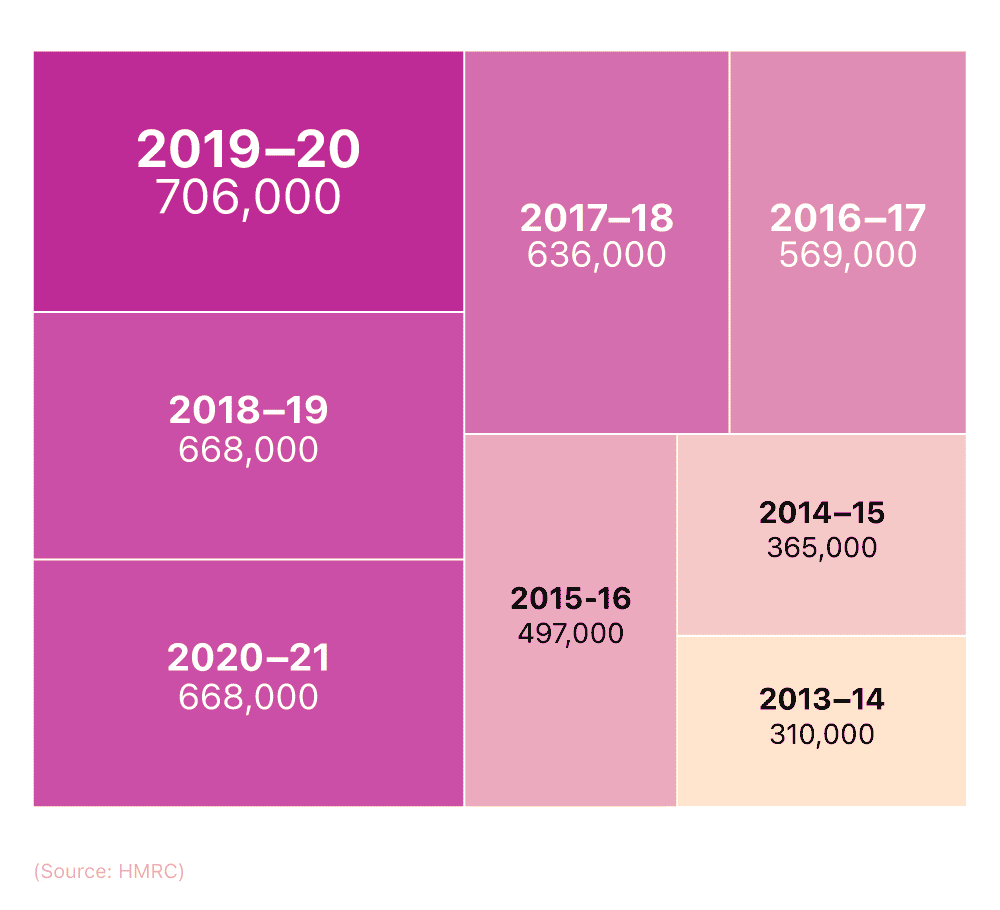
Following a record subscription rate of 706,000 in 2019-20, the junior ISA saving account statistics for 2020-21 marked the first year a decrease occurred in the subscription rate since records began. As of 2021, the number of junior ISA subscriptions stood at 668,000.
Market value of junior ISA accounts
The total market value of junior ISAs continues to grow exponentially every year. The biggest percentage increase occurred in 2018-2019, when the market value increased by almost 35% from the previous year.
A breakdown of junior ISA accounts in the UK by total market value between 2013 and 2021
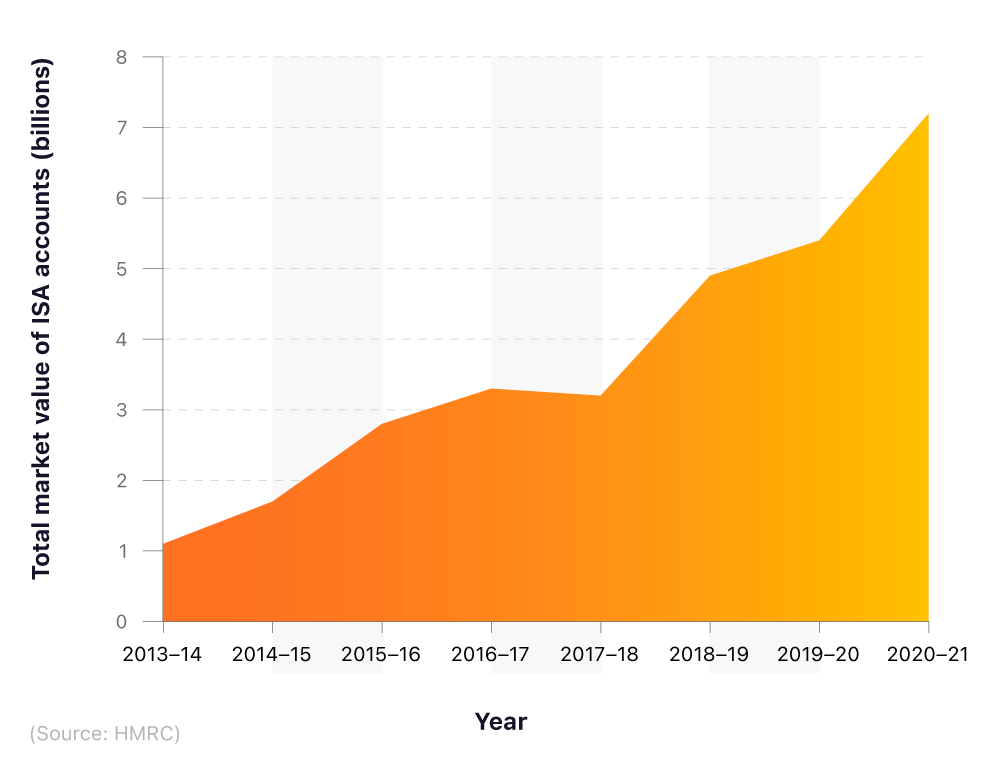
The most recent value increase of £1.8 billion in 2020-2021 represents the biggest annual financial increase since accounts were made available— a 25% increase from 2019-20 and almost seven times more than 2013-14.
With account uptakes remaining high and existing accounts increasing in value, it’s reasonable to expect these figures to continue to accelerate rapidly in the coming years.
Help to Buy ISA statistics
UK Government data compiled as part of our savings report shows that both account payments and home purchases via Help to Buy accounts are on the rise.
The amount of bonuses paid out by the Help to Buy scheme increased by 75% between 2016 and 2017 when it was first launched. Although there haven’t been such meteoric climbs in bonus payout rates since then, progress did trend upwards until 2021, when 121,970 payments were made. In 2022, however, the figures went in the opposite direction, with a 30% decrease resulting in the number of total bonuses being paid falling to 84,615.
The value of the total annual bonus received between 2016-21 almost quadrupled, from £36.01 millon in 2016 to £146.87 million in 2021.
Help to Buy statistics by year
A small decline was seen both in the total value of properties and the number of property completions in 2021 and 2022 (they were down by around £4.5 billion and 27,000 sales, respectively). This seems to be due, at least in part, to the economic downturn.
A breakdown of the total bonuses paid and the value of properties bought through Help to Buy ISAs
| Year | Total bonuses paid | Total value annual bonus (£mn) | Total property completions | Value of properties (£mn) |
|---|---|---|---|---|
| 2016 | 62,239 | £36.01 | 45,656 | £7,732.59 |
| 2017 | 109,493 | £95.76 | 81,642 | £14,108.76 |
| 2018 | 114,684 | £125.57 | 87,974 | £15,423.89 |
| 2019 | 114,350 | £137.98 | 88,573 | £15,512.60 |
| 2020 | 107,490 | £138.98 | 82,693 | £14,681.59 |
| 2021 | 122,008 | £179.19 | 93,506 | £17,025.25 |
| 2022 | 84,615 | £146.87 | 66,689 | £12,457.88 |
(Source: HM Treasury)
The total value of properties witnessed a downturn, dipping by almost 14% between 2021 and 2022. Before that, the property purchase value was steadily increasing, rising from £7,732 million in 2016 to £17,025 million in 2021.
It’s worth noting that you can no longer open a Help to Buy ISA, as the government closed applications on 30 November 2019. Those who have already opened an account can continue saving into it until 30 November 2029.
Help to Save ISA statistics
Help to Save accounts are a government-run savings incentive for UK residents on lower incomes. For those that qualify, the UK government will add 50p for every £1 saved over four years.
Opening a Help to Save account means you can save between £1 and £50 per month. By saving the maximum amount over four years, you’ll have saved £2,400 (48 months x £50). With the UK government bonus of £1,200, this will bring your total savings to £3,600.
Help to Save ISA statistics by year
The annual figures for Help to Save ISA statistics show a significant rise in the number of accounts opened in 2020 compared to 2019 (44%), before a significant decline in new accounts the following year (23%).
This decrease recorded in 2020 – from 104,250 to 80,500 – reflected the changes in eligibility for the accounts during this time, which resulted in fewer people qualifying for a Help to Save account. This figure then stabilised, with only 50 fewer people opening a Help to Save account in 2022 compared to 2021.
The number of new deposits, and their total value, have continued to accelerate. 2020 and 2021 both saw values increase by £33 million, but the rate of increase slowed in 2022, with just an extra £10 million being added.
A breakdown of accounts and value of new deposits of help to save ISAs
| Year | Total number of accounts opened | Number of individuals who made a new deposit | Total value of new deposits (£) | Number of individuals who have made a withdrawal | Total value of withdrawals (£ |
|---|---|---|---|---|---|
| 2019 | 72,150 | 835,100 | 39,543,000 | 37,550 | 4,903,000 |
| 2020 | 104,250 | 1,507,650 | 72,443,000 | 54,400 | 10,454,000 |
| 2021 | 80,500 | 2,155,850 | 105,056,000 | 84,750 | 20,158,000 |
| 2022 | 80,450 | 2,338,850 | 115,594,000 | 98,500 | 28,869,000 |
(Source: HMRC)
Both the number of individuals making a withdrawal and the total value of withdrawals have also continued to rise annually since 2019. The biggest increase in withdrawals occurred between 2020 and 2021, when the total value of withdrawals nearly doubled to over £20 million. During this period, the number of withdrawals rose by more than a third (35%) to 84,750 in 2021.
While the increased number of accounts will naturally increase the likelihood of account withdrawals, these figures may also be due to the rising cost of living that may have resulted in more people making unplanned withdrawals.
Help to Save regional statistics
Our savings report indicates that, as of March 2023, there are almost 350,000 open Help to Save accounts in the UK. Between September 2018 and March 2023 over £372 million has been deposited in the Help to Save accounts, £72 million of which has been subsequently withdrawn.
The North West has the highest number of account holders (59,400) and total deposit value (£48.7 million). The South East has the second highest figures in both categories (51,900 and over £42.8 million, respectively).
A breakdown of Help to Save ISA account holders in the UK by region
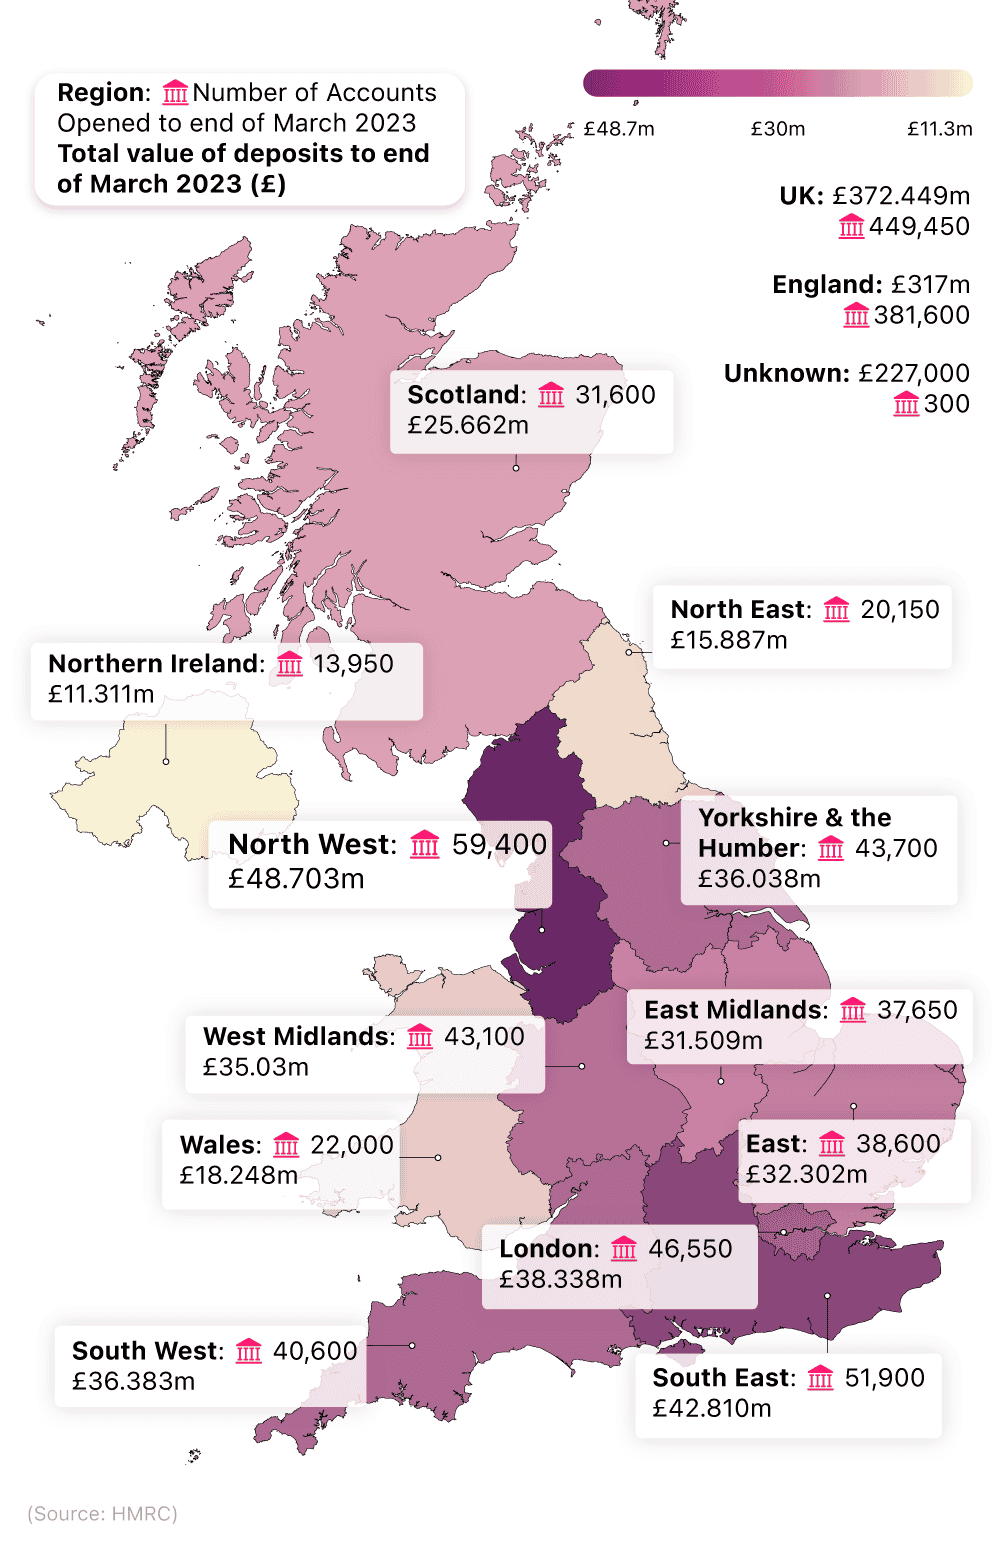
Help to Save figures for account numbers are particularly low in the North East (20,150) compared to the rest of England. The next lowest region, East Midlands, had close to double the number of account subscriptions (37,650).
Beyond England, Northern Ireland’s account opening figures of 13,950 and a total deposit value of just over £11.3 million were by far the lowest in both categories across the UK. By comparison, the respective figures of 22,000 and £18.2 million for Wales and 31,600 and £25.6 million for Scotland provide context between the different countries of the UK.
FAQs
What is the ISA limit?
The ISA (Individual Savings Account) limit is the maximum amount of money you can contribute to your ISAs in a tax year. As of the 2022/2023 tax year, the ISA limit is £20,000. This means you can deposit up to £20,000 across all your ISAs, which could be spread across a Cash ISA, Stocks and Shares ISA, Innovative Finance ISA, or a Lifetime ISA, which has a limit of £4,000 within the £20,000 total.
How does an ISA work?
An ISA, or Individual Savings Account, works by providing a tax-free or tax-efficient wrapper around your savings or investments. Once your money is in an ISA, it can grow through interest or investment gains tax-free. You can choose between different types of ISAs including Cash ISAs, Stocks and Shares ISAs, Innovative Finance ISAs, and Lifetime ISAs. Each type has different rules and is suitable for different purposes.
How to get better at saving money?
Improving your saving habits can be achieved by setting clear financial goals, creating a realistic budget, and tracking your spending. It's also advisable to save a portion of your income regularly, cut unnecessary expenses, and consider using tools or apps that help manage your finances. Over time, these steps can help you become more disciplined with your finances and grow your savings.
Can you have a child trust fund and a junior ISA?
Yes, a child can have both a Child Trust Fund (CTF) and a Junior ISA, but you cannot contribute to both in the same tax year.
How are employer pension contributions calculated?
Employer pension contributions are typically calculated as a percentage of the employee's earnings. The percentage contributed can vary based on the employer's pension scheme and the terms of employment. Some employers may match the employee's contributions up to a certain percentage, while others may have a fixed contribution percentage regardless of the employee's contribution.
Methodology and sources
https://www.bsa.org.uk/media-centre/bsa-blog/september-2022/savings-accounts-it-pays-to-shop-around
https://commonslibrary.parliament.uk/research-briefings/cbp-7812/
https://www.gov.uk/government/statistics/annual-savings-statistics-2022
https://www.gov.uk/government/statistics/annual-savings-statistics-2023
https://maps.org.uk/en/media-centre/press-releases/2022/one-in-six-uk-adults-have-no-savings
https://www.bankofengland.co.uk/statistics/money-and-credit/2023/august-2023
https://www.bankofengland.co.uk/statistics/money-and-credit/2023/june-2023
About Lucinda O'Brien
Lucinda is a senior finance editor at money.co.uk and helps people to make confident financial decisions so they can make the most of their money.