UK business statistics and facts 2026

This page includes relevant UK business statistics for 2026, such as growth and borrowing across various sectors, the impact of the cost-of-living crisis, and how the UK business landscape compares to previous years.
It’s been a difficult time for those running a business over the past 20 years, with the 2008 financial crisis, Brexit, the COVID-19 pandemic, and the cost-of-living crisis heightened by global conflicts affecting the stability of businesses across many industries.
Despite this, the latest UK business statistics found that, at the start of 2025, there were around 5.7 million businesses registered in the UK. According to UK small business statistics, 99.85% of those businesses were classified as small and medium-sized enterprises (SMEs).
Delve deeper into the business landscape and explore the UK business market further with our comprehensive business stats and facts for 2026.
What counts as an SME?
SMEs are businesses with fewer than 250 employees. They are usually grouped into microbusinesses with under 10 employees, small businesses with under 50 employees, and medium-sized businesses with under 250 employees.
Top 10 must-read UK business statistics for 2026
There were 5.69 million private-sector businesses in the UK at the start of 2025, up 3.5% from the previous year. money.co.uk forecasts suggest this could fall to around 5.47 million in 2026.
There were 305,495 new-business births in the UK in 2025, with the 2026 total forecast to reach around 297,210, a decrease of around 2.7%.
Business closures are expected to edge down slightly, from 266,025 in 2025 to 265,022 in 2026, according to money.co.uk.
Almost all UK businesses were SMEs in 2025, with 5.68 million SMEs representing 99.85% of the total business population.
Small businesses accounted for 46.7% of total business employment in 2025, supporting just under half of UK business jobs.
Sole proprietorships remained the most common legal form of business in 2025, making up 57% of all UK private-sector businesses.
London had the highest number of businesses in the UK in 2025, with 1.04 million private-sector businesses, accounting for 18.3% of the UK total.
Construction was the biggest UK industry by number of businesses in 2025, with 885,485 businesses.
HSBC was the UK’s biggest company by market capitalisation as of May 2026, valued at approximately £230.12 billion.
Wales had the highest share of female-led high-growth companies, at 16.3% in 2025.
UK business size statistics
How many businesses are there in the UK?
According to the Department for Business and Trade, there were 5.69 million businesses in the UK in 2025, employing around 28.1 million people. The vast majority were SMEs, with the number of SMEs in the UK reaching 5.68 million, representing almost the entire UK business population.
Number of businesses in the UK and their employment, 2025
| Business count | Employment (thousands) | |
|---|---|---|
| All businesses | 5,690,265 | 28,128 |
| SMEs (0 to 249 employees) | 5,681,930 | 16,882 |
| Small businesses (0 to 49 employees) | 5,643,495 | 13,144 |
| With no employees | 4,272,535 | 4,664 |
| All employers | 1,417,730 | 23,464 |
| of which: | ||
| 1 to 9 employees | 1,150,875 | 4,156 |
| 10 to 49 employees | 220,085 | 4,324 |
| 50 to 249 employees | 38,435 | 3,738 |
| 250 or more employees | 8,335 | 11,246 |
Source: Data from the Department for Business and Trade’s Business population estimates for the UK and regions 2025: statistical release
The number of small businesses in the UK was also high, at 5.64 million. Businesses with no employees accounted for 4.27 million. By comparison, only 8,335 businesses had 250 or more employees. This shows that the UK business population is dominated by SMEs, particularly non-employing businesses.
Small business statistics
How many jobs are created by small businesses?
Small businesses made up almost all UK businesses (99.2%) in 2025 and supported just under half of total business employment (46.7%). These UK small business statistics show that small businesses are a major source of jobs in the UK, even though they generated around a third of total business turnover (34%).
Contribution of different-sized businesses to the total population, employment, and turnover, 2025
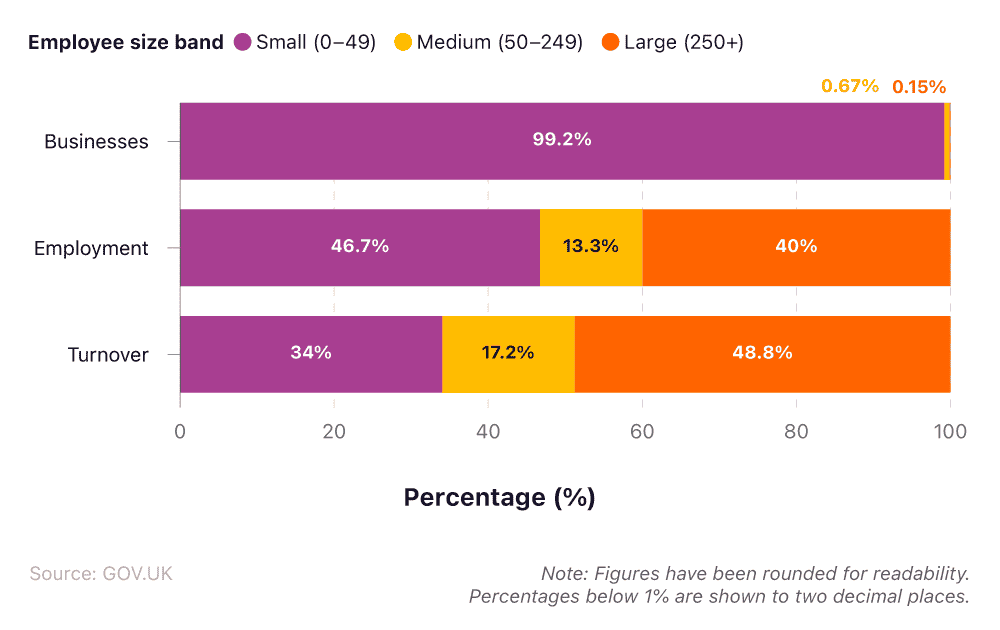
Large businesses, by comparison, represented just 0.15% of the UK private-sector business population in 2025 (equivalent to around one in every 670 businesses). Despite representing a very small share of businesses by number, they were responsible for 40% of employment and almost half of total turnover (48.8%).
The data show a clear contrast between the business population and economic output, with small businesses dominating in volume while larger firms contribute a disproportionate share of turnover.
How has the business population changed since 2010?
The UK business population has grown significantly since 2010. There were 4.48 million private-sector businesses in the UK in 2010, rising to 5.69 million in 2025.
This is an increase of 1.21 million businesses, or 26.9%. Most of this growth has come from SMEs and non-employing businesses, which continue to make up the majority of the UK business population.
Number of private-sector businesses (in thousands) in the UK, 2010, 2020–2028
| Employment size band | 2010 | 2020 | 2021 | 2022 | 2023 | 2024 | 2025 | 2026* | 2027* | 2028* |
|---|---|---|---|---|---|---|---|---|---|---|
| All private sector | 4,483 | 5,981 | 5,591 | 5,509 | 5,555 | 5,499 | 5,690 | 5469 | 5421 | 5373 |
| All SME (0 to 249) | 4,477 | 5,973 | 5,583 | 5,501 | 5,547 | 5,491 | 5,682 | 5461 | 5413 | 5365 |
| All small (0 to 49) | 4,477 | 5,937 | 5,548 | 5,465 | 5,510 | 5,453 | 5,643 | 5422 | 5373 | 5324 |
| All employers (1+) | 1,224 | 1,413 | 1,416 | 1,448 | 1,445 | 1,427 | 1,418 | 1433 | 1435 | 1436 |
| Non-employers | 3,259 | 4,568 | 4,175 | 4,061 | 4,110 | 4,072 | 4,273 | 4036 | 3987 | 3937 |
| Micro (1 to 9) | 1,015 | 1,157 | 1,162 | 1,187 | 1,177 | 1,161 | 1,151 | 1162 | 1160 | 1159 |
| Small (10 to 49) | 174 | 212 | 211 | 217 | 223 | 220 | 220 | 224 | 227 | 229 |
| Medium (50 to 249) | 29 | 36 | 36 | 36 | 37 | 38 | 38 | 39 | 39 | 40 |
| Large (250+) | 6 | 8 | 8 | 8 | 8 | 8 | 8 | 8 | 8 | 8 |
Source: Data from the Department for Business and Trade’s Business population estimates for the UK and regions 2025: statistical release, Trends in the business population, money.co.uk
Note: 2010 is included as a comparison year. Annual data is shown from 2020 onwards. Figures for 2026 to 2028 are forecasts.
However, the number of businesses has fluctuated in recent years. The total reached 5.98 million in 2020, then fell to 5.49 million in 2024, a decline of around 8.1%. In 2025, the business population increased again to 5.69 million, suggesting a recovery after several years of decline.
Forecasts point to a slight decline in the business population over the next few years, rather than continued growth. The number of private-sector businesses is expected to fall from 5.47 million in 2026 to 5.37 million by 2028.
This would represent a decrease of around 96,000 businesses, or 1.8%, over the forecast period. Compared with 2025, the 2028 forecast would be around 317,000 businesses lower, a decline of 5.6%.
Small business creation statistics
How many new businesses are started each year in the UK?
The latest small-business creation statistics show that the number of new-business births in the UK has remained relatively steady, although levels are lower than in 2022.
There were 305,495 new-business births in 2025, compared with 310,610 in 2024 and 306,180 in 2023. This suggests that new-business activity has stayed fairly consistent over the last three years, after falling from the higher level of 327,510 business births recorded in 2022.
Number of new-business births in the UK, 2022–2026
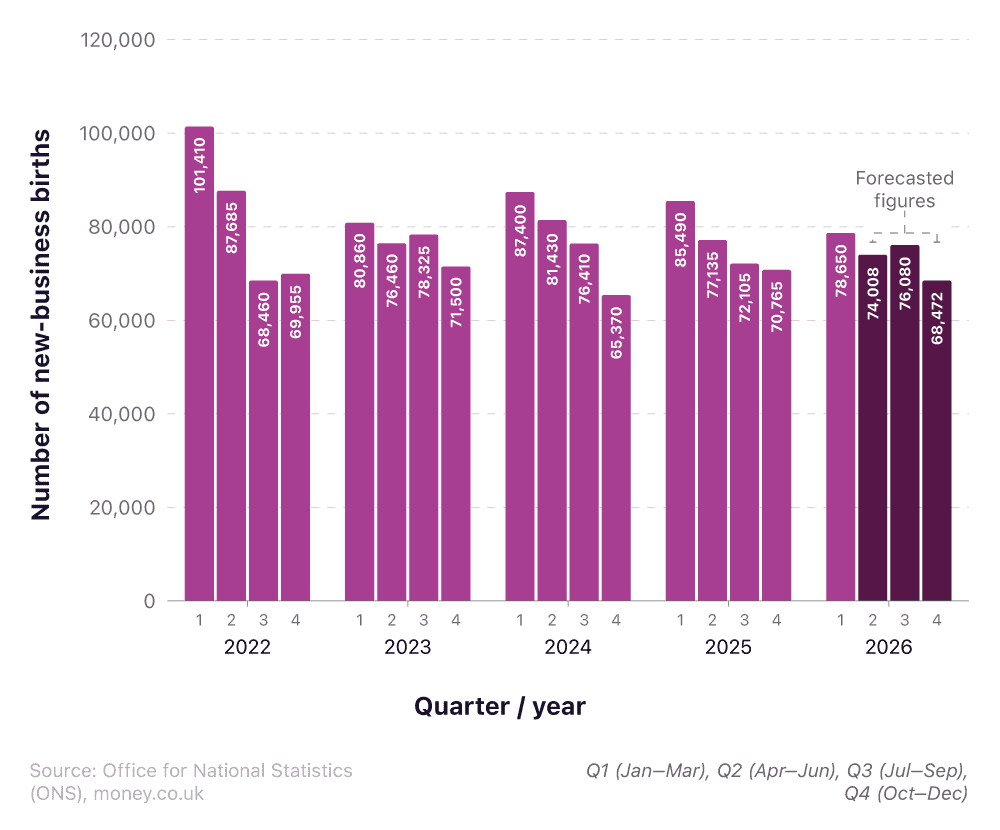
Looking at quarterly trends, Q1 is the strongest period for new-business births, with 85,490 businesses started in Q1 2025 and 78,650 in Q1 2026.
Forecasted data for Q2, Q3, and Q4 2026 suggests new-business births could fall to 74,008 in Q2, rise slightly to 76,080 in Q3, and drop again to 68,472 in Q4.
Overall, this would bring the projected 2026 total to around 297,210 new-business births, slightly below the 2025 total but still close to the 300,000 mark.
Business owner statistics
What kind of firms make up the UK’s business population?
There are three main legal forms of business in the private sector:
1. Sole proprietorships (also known as sole proprietorships): A business owned and run by one person, and there is no legal distinction between the owner and the business entity.
2. Ordinary partnerships: A business owned and run by two or more people. No formal agreement is necessary, and partners share risks, costs, and responsibilities.
3. Companies: A business owned by its members. There is limited liability, which means the company’s finances are separate from the personal finances of its owners, and creditors may only pursue the company’s assets to settle a debt.
At the start of 2025, sole proprietorships were the most common legal form of business in the UK private sector, making up well over half of all businesses (57%).
These business owner statistics show there were around 3.2 million sole proprietorships, compared with 2.1 million companies and 368,000 ordinary partnerships. Companies made up just over a third of businesses (37%), while ordinary partnerships represented a much smaller share at 6%.
Number of UK businesses in the private sector, with and without employees, 2025
| Business type | Number of businesses | Percentage of all businesses | Businesses with employees | Businesses with no employees |
|---|---|---|---|---|
| Sole proprietorships | 3.2 million | 57% | 180,000 | 3.0 million |
| Companies | 2.1 million | 37% | 1.2 million | 948,000 |
| Ordinary partnerships | 368,000 | 6% | 81,000 | 287,000 |
Source: Data from the Department for Business and Trade’s Business population estimates for the UK and regions 2025: statistical release, Legal form
The data also highlights the high number of sole traders in the UK, with most sole proprietorships operating without employees. Around three million sole proprietorships had no employees, compared with 180,000 that employed staff.
Companies were more likely to be employer businesses, with 1.2 million employing staff and 948,000 operating without employees.
This shows that the UK business population is still largely made up of self-employed and owner-operated businesses. However, companies continue to account for a significant share of the total, with 2.1 million active in the UK private sector in 2025.
UK business location statistics
Which area of the UK is home to the most businesses?
As of the start of 2025, London was home to the most businesses in the UK, with 1.04 million private-sector businesses. This means the capital alone accounted for 18.3% of all UK businesses, making it the largest regional business hub.
The South East had the second-highest number of businesses, with 876,625, representing 15.4% of the UK total. This was followed by the East of England with 578,755 businesses (10.2%) and the South West with 562,390 businesses (9.9%).
London and the South East alone were home to around 1.92 million businesses, representing 33.7% of the UK business population. This shows that business activity remains heavily concentrated in the south of England.
Number of businesses in the UK private sector by UK region and nation, 2025
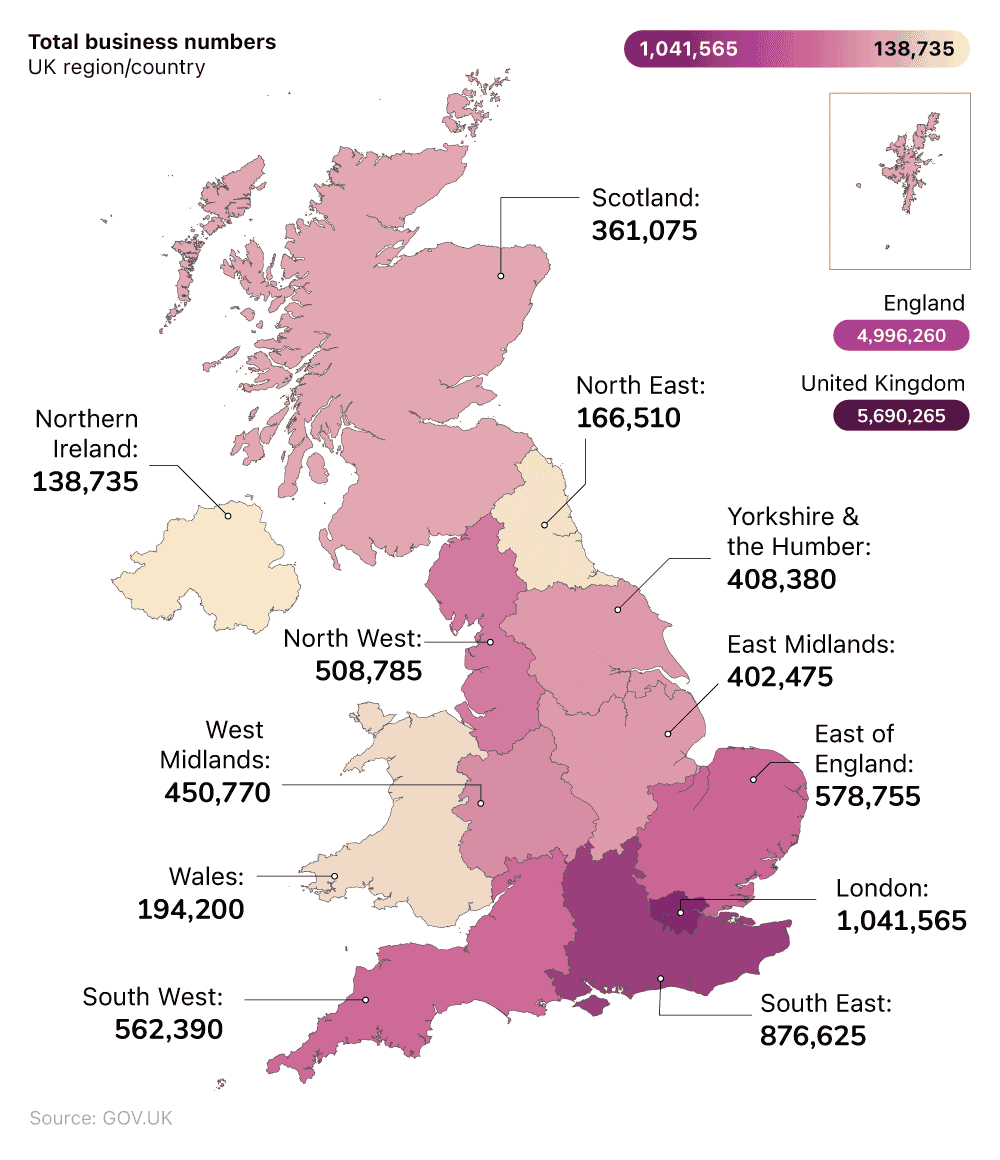
England continued to dominate the UK business count, with 5.00 million businesses, making up 87.8% of the UK total. Scotland had 361,075 businesses (6.3%), Wales had 194,200 (3.4%), and Northern Ireland had 138,735 (2.4%).
Looking specifically at the English regions, the North East had the fewest businesses among English regions, with 166,510 private-sector businesses, accounting for just 2.9% of UK businesses.
UK industry statistics by sector and industry
What are the biggest industries in the UK?
The UK industry statistics indicate that construction was the biggest industry in the country by number of businesses in 2025, with 885,485 businesses. This represents 15.6% of all UK businesses.
Number of UK businesses by industry, 2025
| Industry | Number of businesses |
|---|---|
| Construction | 885,485 |
| Professional, scientific, and technical activities | 819,465 |
| Wholesale and retail trade; vehicle repair | 548,515 |
| Administrative and support service activities | 474,780 |
| Human health and social work activities | 397,995 |
| Information and communication | 353,035 |
| Transportation and storage | 328,960 |
| Education | 312,735 |
| Arts, entertainment, and recreation | 277,185 |
| Manufacturing | 263,085 |
| Accommodation and food service activities | 233,080 |
| Real estate activities | 154,770 |
| Financial and insurance activities | 89,235 |
| Other service activities | 376,080 |
Source: Data from the Department for Business and Trade’s Business population estimates 2025 official statistics, Business population estimates for the UK and regions 2025: detailed tables (MS Excel), Table 4
Professional, scientific, and technical activities followed closely behind, with 819,465 businesses, while wholesale and retail trade, including vehicle repair, ranked third with 548,515 businesses. This suggests that the UK’s business base is strongly shaped by service-led and consumer-facing sectors.
Smaller sectors by business count included financial and insurance activities (89,235 businesses), real estate (154,770), and accommodation and food services (233,080). However, these figures should be viewed in context, as a lower number of businesses doesn’t necessarily mean a smaller economic role.
Some sectors are made up of fewer but larger businesses, so their overall impact may be greater than the number of businesses alone suggests.
Which sectors are growing in the UK the most?
The latest data on which sectors are growing in the UK suggests that manufacturing SMEs were the most likely to report growth in 2025.
Nearly one in three manufacturing SMEs (32%) said they had achieved growth in the last 12 months, followed by agriculture (31%) and property/business services (30%).
Percentage of SMEs that achieved growth in the last 12 months in the UK, 2025
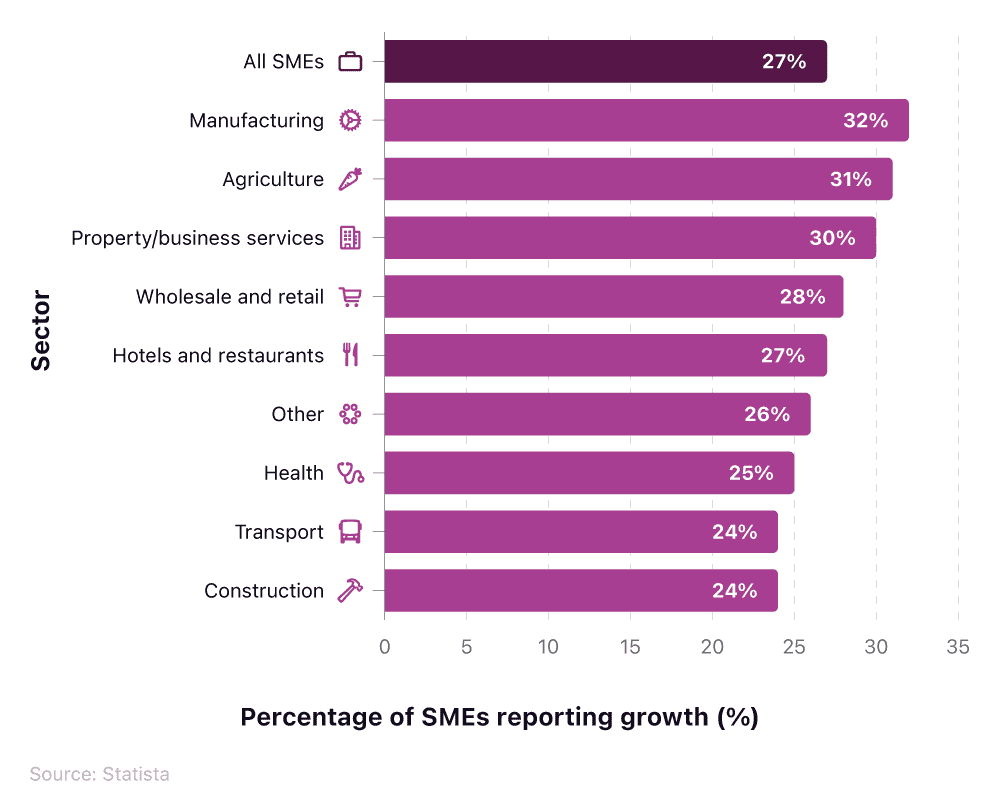
Across all SMEs, just over a quarter (27%) reported growth, indicating that growth was not limited to any one part of the economy. Wholesale and retail SMEs sat slightly above the average at 28%, while hotels and restaurants matched the all-SME average at 27%.
Business growth was modest in other sectors, with around one in four SMEs in health (25%) and transport (24%) achieving growth in 2025.
Construction reported one of the lower growth rates at 24%, despite being the UK’s largest sector by business count in 2025.
Statistics on business failure
Company dissolutions and liquidations provide useful context for understanding business closures in the UK. However, not every dissolved company should automatically be treated as a failed business, as companies can be removed from the register for different reasons, including voluntary closure, owner retirement or administrative reasons such as failing to file accounts.
In 2024–25, 726,735 companies were dissolved in the UK, making this the largest closure-related category. A further 112,418 companies were in liquidation, while 443,076 were in the course of dissolution, meaning they were going through the process of being removed from the register.
Number of dissolved and insolvent companies by region in the UK, 2024–25
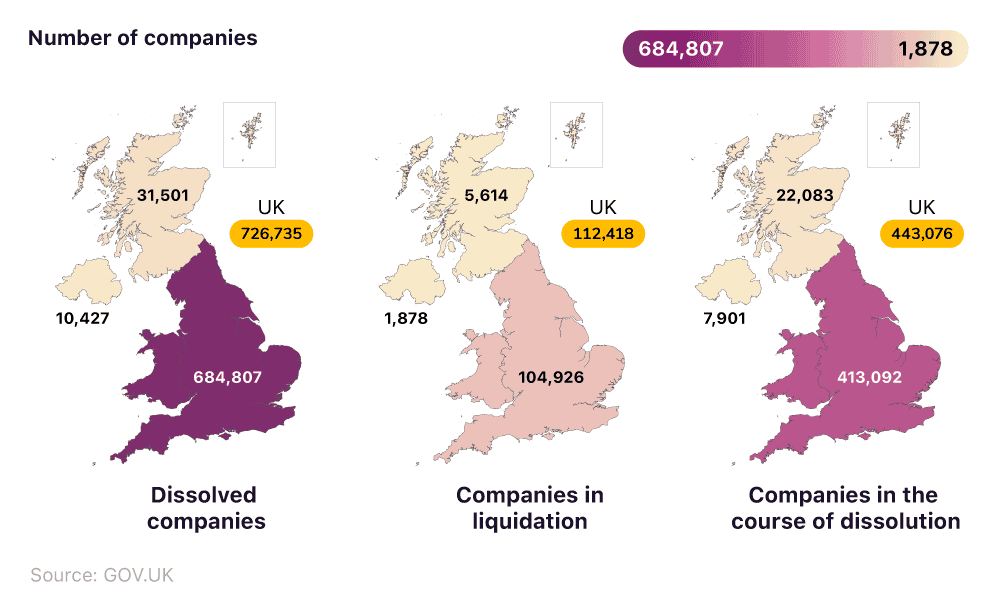
England and Wales accounted for the majority of all three categories, with 684,807 dissolved companies, 104,926 companies in liquidation, and 413,092 companies going through dissolution.
Scotland and Northern Ireland recorded much lower figures but still contributed to the wider picture of company closures across the UK.
How many businesses fail each year?
Business closures in the UK have fallen since their recent peak in 2022. There were 286,025 business closures in 2025, down from 295,190 in 2024 and 332,630 in 2023. The highest total in this period was recorded in 2022, when 375,500 businesses closed, meaning closures were almost a quarter lower (23.8%) by 2025.
Number of business closures in the UK by quarter (2022–2026)
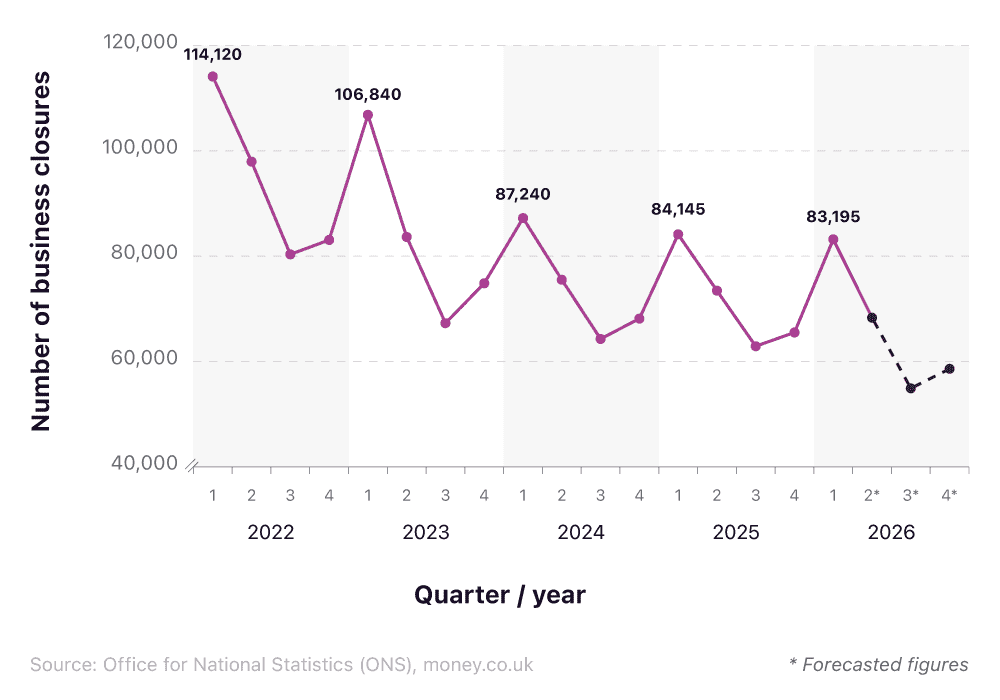
Across the years shown, Q1 usually had the highest number of closures. In 2025, closures fell from 84,145 in Q1 to 65,520 in Q4, a decrease of just over a fifth (22.1%) across the year. This shows that business closures were higher at the start of the year than at the end.
Looking ahead, the business statistics forecast that closures could continue to fall. Based on the current money.co.uk forecast, there could be 265,022 business closures by the end of 2026. Q1 recorded 83,195 closures, while forecasts suggest this could fall to 68,316 in Q2, 54,903 in Q3, and 58,608 in Q4. This would represent a decrease of almost a third (29.6%) between Q1 and Q4.
Small business profits statistics
Profitability was common among UK SMEs, with 71% making a profit. However, profitability varied by sector, with health SMEs recording the highest share of profitable businesses at 76%. This was followed by construction and property/business services, where 74% of SMEs made a profit in each sector.
Percentage of SMEs that made a profit in the UK by sector
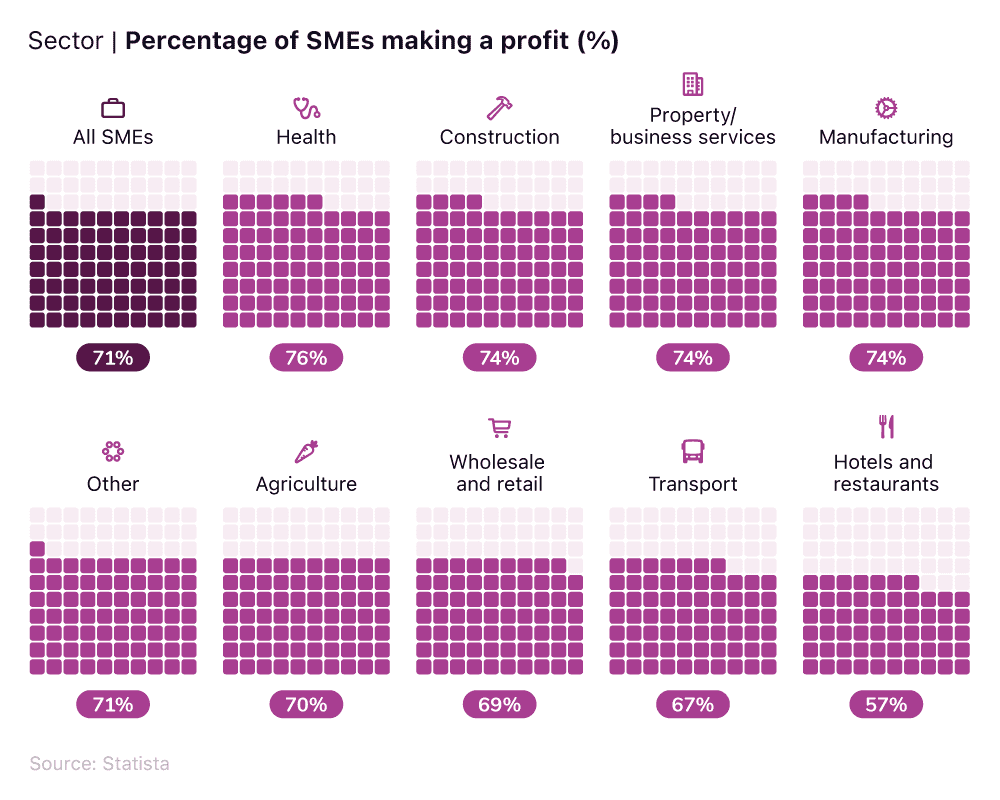
The lowest profitability rate was recorded by hotels and restaurants, where 57% of SMEs made a profit. This means just under six in 10 hospitality SMEs were profitable, compared with around three in four health SMEs.
Transport (67%) and wholesale and retail (69%) were also among the lower-performing sectors.
Analysis of UK business performance 2025
SME profitability improved between 2024 and 2025. In Q1 2024, around two-thirds of SMEs made a profit (67%) before rising to 71% in Q1 2025. Profitability remained fairly steady throughout 2025, with 71% to 72% of SMEs reporting a profit across the year.
Business performance of SMEs in the UK, Q1 2024 to Q4 2027
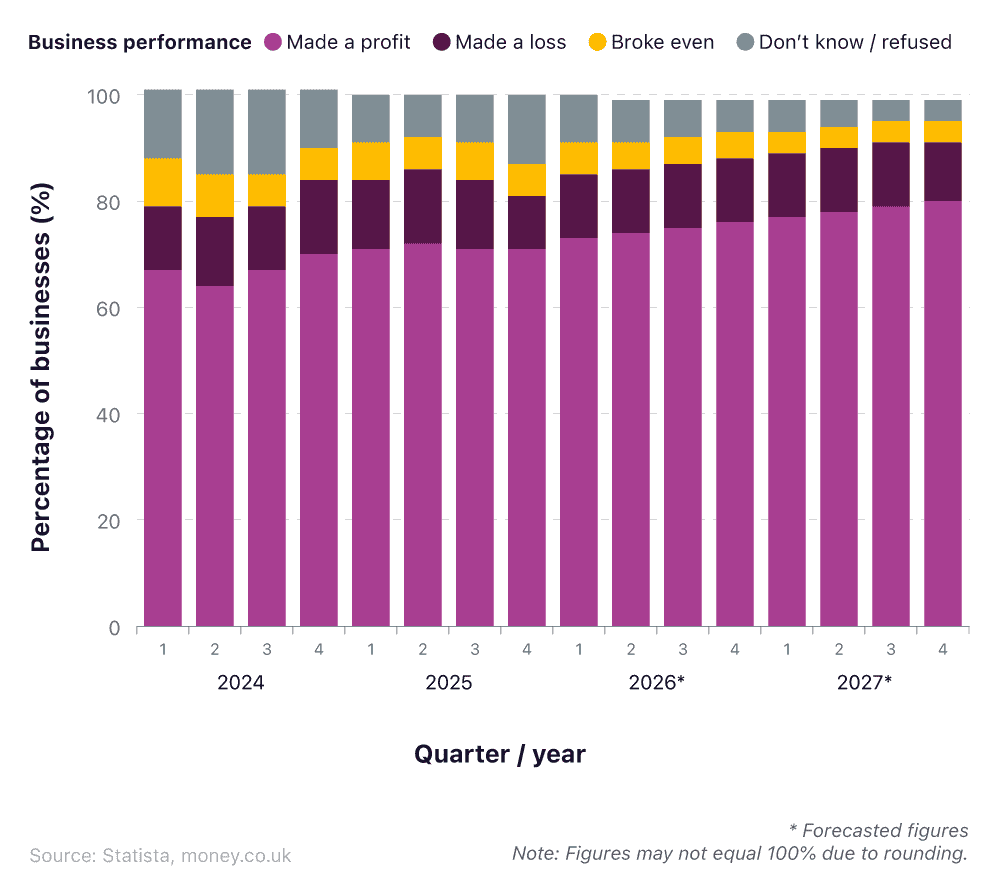
The share of SMEs making a loss was lower and relatively stable. In 2025, this ranged from 14% in Q2 to 10% in Q4, meaning around one in 10 to one in seven SMEs reported making a loss. The proportion of SMEs breaking even also stayed low, ranging from 6% to 7% during 2025.
Business statistics forecasts indicate that SME profitability could continue to improve from 2026 onwards. The share of SMEs turning a profit is projected to rise from 73.4% in Q1 2026 to 79.9% by Q4 2027. If this trend continues, close to eight in 10 SMEs could be making a profit by the end of 2027.
UK business finance statistics 2025
UK business lending statistics 2025
SME lending increased in 2025, with gross lending rising to £17.5 billion, up from £16.2 billion in 2024 and £14.3 billion in 2023. These business loan statistics indicate that more finance was being issued to SMEs, with loan approvals also increasing from around 36,600 in 2023 to 51,000 in 2025.
Net lending remained negative across the period, but the gap narrowed each year. It improved from -£11.1 billion in 2023 to -£7.2 billion in 2024, a reduction of around 35%. By 2025, it had narrowed further to -£4.5 billion, around 37% lower than in 2024 and around 59% lower than in 2023.
Overview of SME lending trends in the UK, 2023–2025
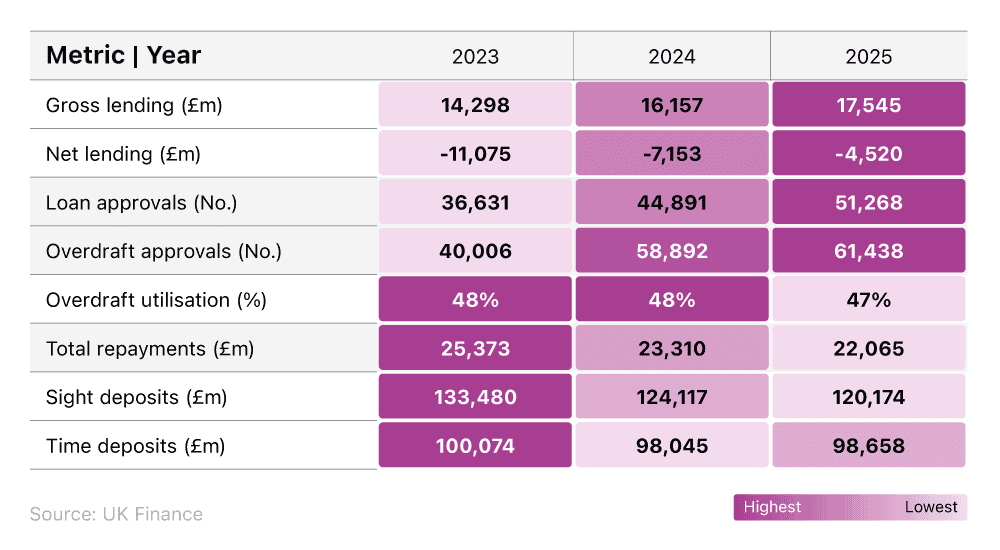
Repayments also declined, falling from around £25.4 billion in 2023 to around £22.1 billion in 2025. At the same time, overdraft approvals increased from around 40,000 to 61,400, although overdraft utilisation stayed broadly stable at 47-48%.
Overall, the data points to a gradual recovery in SME finance activity, with more lending and approvals alongside lower repayments.
Looking for a better way to manage your business finances? Visit our site to compare the best deals on business savings accounts alongside expert advice on opening a savings account.
UK business insurance statistics
Recent UK business insurance statistics show that around half of SMEs surveyed hold core liability cover, including public liability insurance (57%) and employers’ liability insurance (50%). A range of other business insurance products are typically held by three in 10 SMEs.
According to the Association of British Insurers (ABI), three-quarters of SMEs purchase insurance as part of combined cover packages. Businesses set their policies through broker comparison websites or directly with insurers.
Business insurance costs vary considerably depending on the size of the company. Sole traders typically spend between £250 and £499 per year, while businesses with 50–249 employees can spend between £10,000 and £19,999 annually on insurance cover.
Business insurance claims are also relatively common, with around four in 10 SMEs surveyed reporting that they have made a claim in the past.
What are the biggest risks facing businesses?
Cyber incidents were the biggest global business risk in 2026, rising from 38% in 2025 to 42%. Artificial intelligence saw the sharpest increase, climbing from one in 10 (10%) to almost a third (32%), making it the second-biggest business risk in 2026. Business interruption ranked third, although it fell slightly from 31% in 2025 to 29% in 2026.
Overview of the top 10 global business risks, 2025–2026
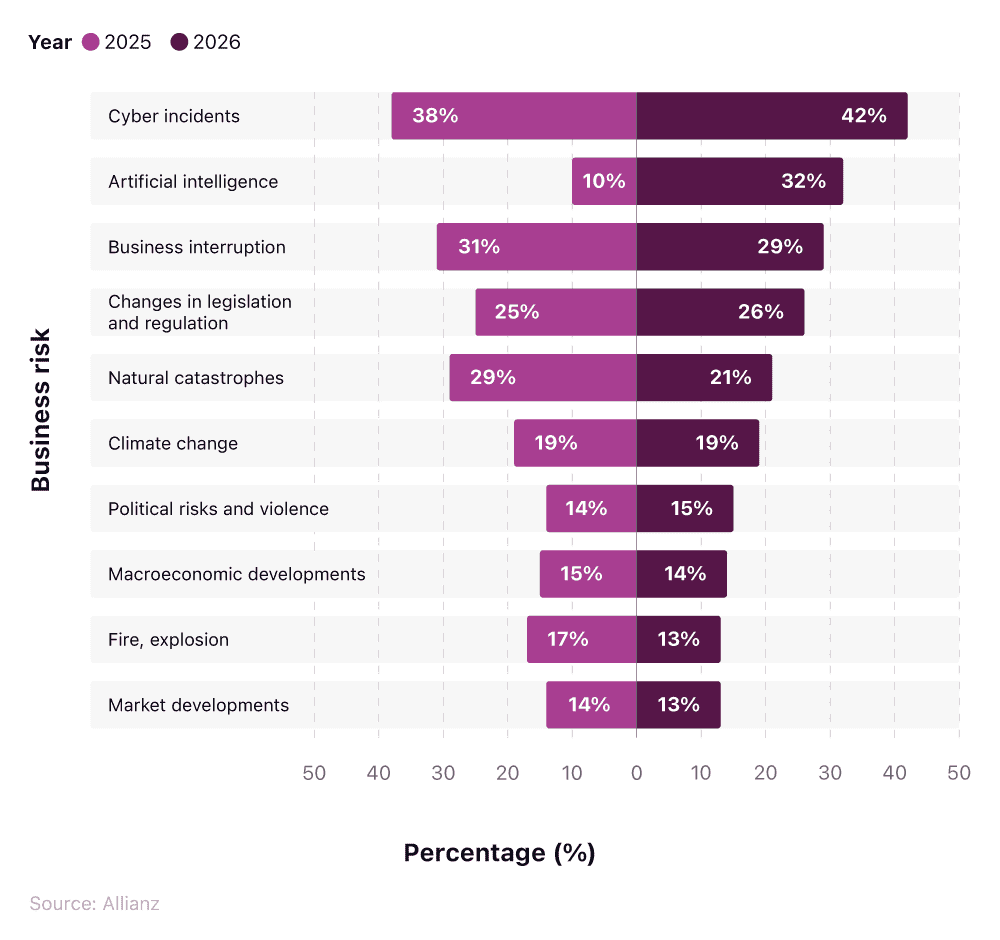
The lower-ranked risks in the top 10 were macroeconomic developments (14%), fire and explosion (13%), and market developments (13%) in 2026. Each of these risks declined slightly compared with 2025, meaning they remained relevant but were less prominent than the leading concerns.
Overall, cyber incidents remained the top risk, but the rise of artificial intelligence was the most notable year-on-year change.
How many UK businesses have cyber insurance?
Just under four in 10 UK businesses (37%) had cybersecurity cover as part of a wider insurance policy in 2025/2026. By comparison, only one in 10 businesses (10%) had a specific cybersecurity insurance policy, showing that most organisations with protection were relying on broader cover rather than standalone cyber insurance.
Percentage of organisations with cybersecurity insurance protection, 2025–26
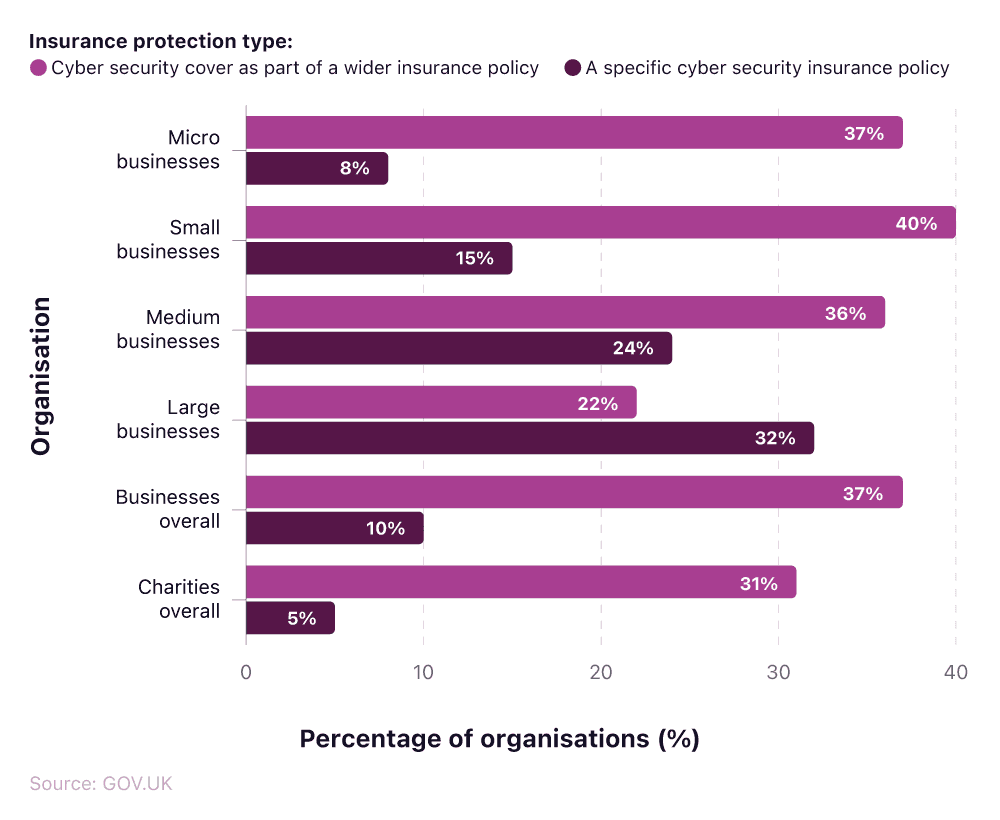
Smaller businesses were more likely to have cyber cover included within a wider policy. This applied to two in five small businesses (40%) and just under four in 10 micro businesses (37%). However, dedicated cyber insurance became more common as organisation size increased.
Among large businesses, almost one in three (32%) had a specific cybersecurity insurance policy, compared with around one in four medium businesses (24%) and fewer than one in 10 micro businesses (8%).
This suggests that larger organisations are more likely to invest in standalone cyber protection, while smaller businesses tend to rely on wider insurance policies.
eCommerce industry statistics
What is the UK eCommerce market size?
The UK is one of the largest online retail markets in the world. UK eCommerce revenue is forecast to reach $185.97 billion (£141.95 billion) by 2029, with an average annual growth rate of 7.01%.
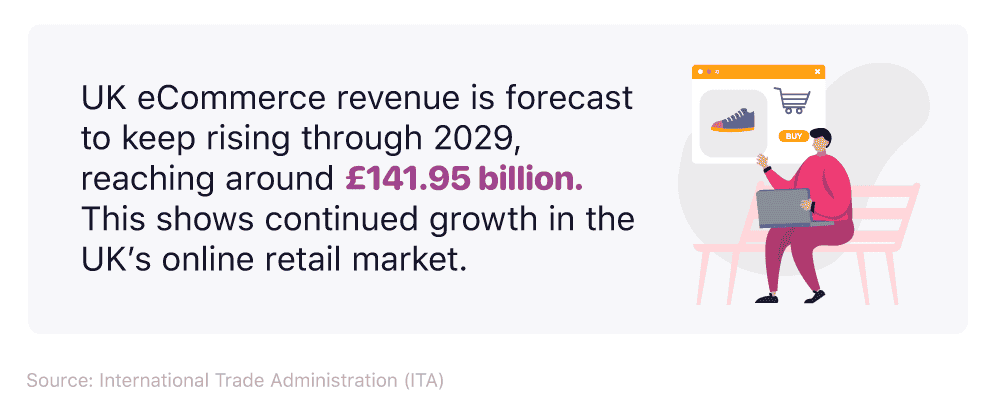
The UK currently has the third-largest eCommerce market globally, behind only China and the United States. Online shopping also accounts for a substantial share of retail activity, with retail eCommerce sales expected to represent over one third (38.1%) of total retail sales in 2025.
Ongoing growth across the UK eCommerce market size shows that more consumers are choosing the convenience of shopping online over traditional retail methods.
Online business statistics
Mobile commerce statistics show that convenience is the biggest driver of mobile shopping. More than half of consumers (53%) said they value being able to discover, research, and buy products anytime, anywhere, making flexibility the most important mobile shopping feature.
Percentage of consumers influenced by mobile shopping features
| Mobile Shopping Feature Consumers Value Most | Percentage |
|---|---|
| Discover, research, and purchase products anytime, anywhere | 53% |
| In-app or mobile-exclusive sales and discounts | 44% |
| One-click payment options (Apple Pay, Google Pay, etc.) | 33% |
| Push notifications for sales and discounts | 22% |
| Integration with delivery or pickup options | 14% |
| Social media shopping (TikTok Shop, Instagram Shopping) | 11% |
| Camera-based product search (Google Lens, etc.) | 10% |
| Augmented reality (AR) shopping features | 7% |
Source: Salsify and Digital Shelf Institute’s Ecommerce Pulse Report: Q2 2025
Price and payment features were also important. More than two in five consumers (44%) valued in-app or mobile-exclusive discounts, and around one in three (33%) valued one-click payment options such as Apple Pay and Google Pay. This suggests that shoppers value mobile experiences that are quick and offer a clear benefit.
More advanced or emerging features were less influential. Around one in 10 consumers were influenced by social media shopping (11%) and camera-based product search (10%). Fewer consumers valued augmented reality shopping features (7%), indicating that practical features such as discounts and easy checkout remain the main priorities.
Women in business statistics
Just over half of female founders (53%) defined success through stability and profitability, making sustainable revenue and financial security the most common priority for women in business.
Table 6: Business success priorities among female founders, 2025
| Success factor | Share of female founders | What it means |
|---|---|---|
| Stability and profitability | 53% | Sustainable revenue and financial security |
| Scale and exit | 38% | Growth ambitions and acquisition potential |
| Social impact | 28% | Positive societal contribution |
| Self | 21% | Work-life balance and wellbeing |
Source: Female Founders Rise’s The Rise Report of Female Entrepreneurship
Growth also mattered, with 38% focused on scale and exit opportunities, including acquisition potential. However, success is not only financial for female founders. More than a quarter (28%) cited social impact, and 21% pointed to personal wellbeing and work-life balance, suggesting that many founders are balancing business growth with purpose and long-term sustainability.
Female employment by sector in the UK
As part of wider women-in-business statistics, the data shows that female employment in the UK is heavily concentrated in the service sector. In 2025, more than nine in 10 women in employment worked in services (92.3%), compared with 7.2% in industry and 0.5% in agriculture.
Share of female employment by economic sector in the UK, 2021–2028
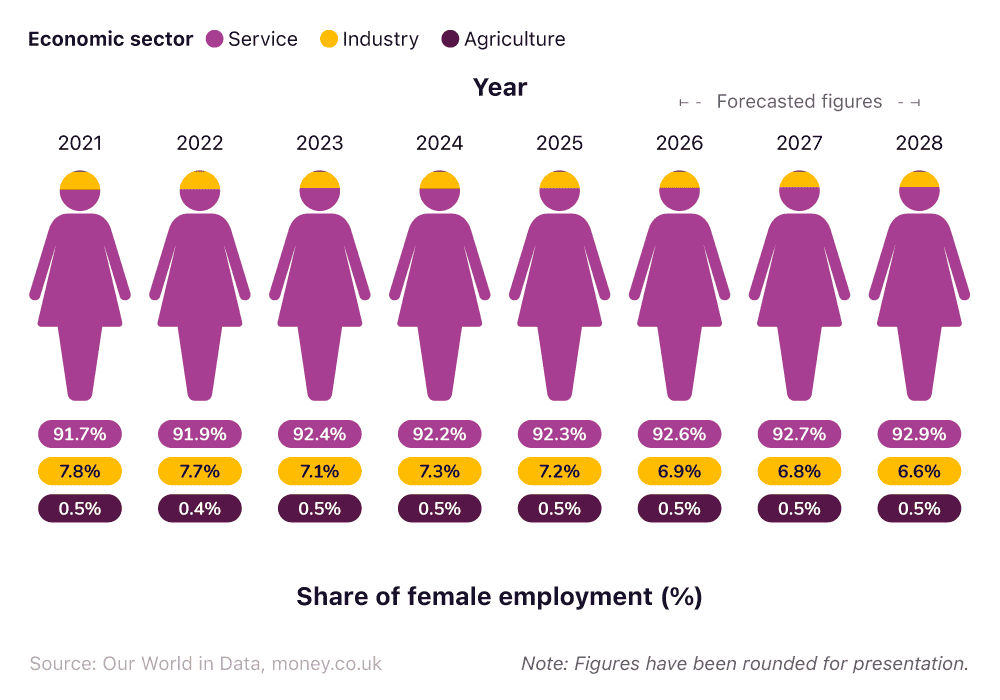
This pattern has stayed largely consistent since 2021. The share of women working in services increased slightly from 91.7% in 2021 to 92.3% in 2025, while the share working in industry fell from 7.8% to 7.2% over the same period. Agriculture remained insignificant throughout, staying close to 0.5%.
According to the business statistics forecast, the service sector is expected to account for 92.85% of female employment by 2028, with industry falling to 6.62% and agriculture remaining almost unchanged at 0.53%. This suggests that women’s employment is likely to remain strongly service-led, with only a small share working in industry or agriculture.
Female entrepreneurs UK statistics
Female-led companies remained underrepresented among high-growth businesses in the UK in 2025. Across the UK, 13.2% of active high-growth companies were female-led, meaning roughly one in eight high-growth businesses had female leadership.
Representation of female-led high-growth companies in the UK, 2025
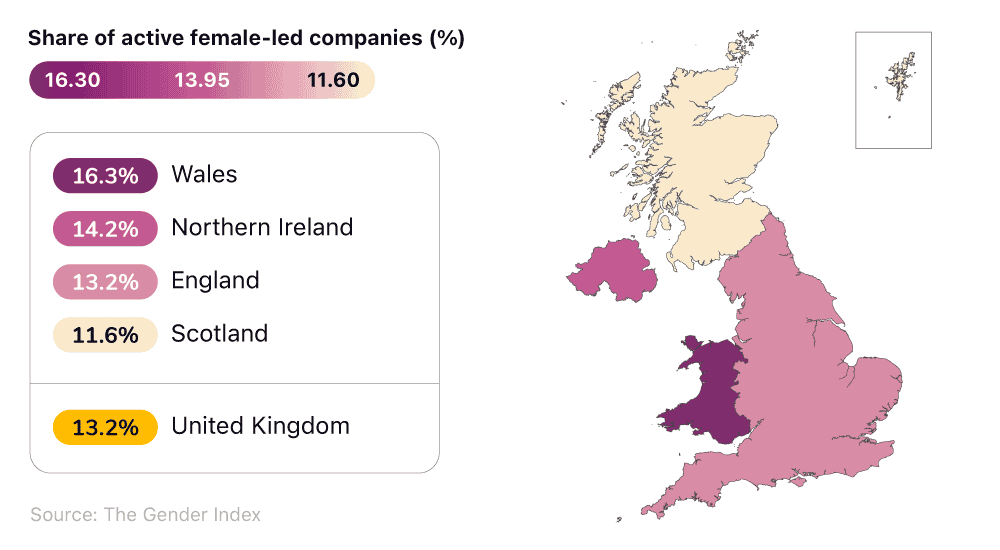
Wales had the highest share of female-led high-growth companies, at 16.3%, followed by Northern Ireland at 14.2%. England matched the UK average at 13.2%, while Scotland had the lowest share at 11.6%.
Overall, the figures show that female-led high-growth businesses are still a relatively small part of the UK company base, with every nation recording a share below one in five.
Male vs female business statistics
Male vs female business statistics reveal a clear gender imbalance in business leadership in London. In 2025, 62.4% of companies in London were male-led, compared with 18.6% that were female-led. Across the UK, female-led companies accounted for 18% of all active companies in 2025.
Business leadership representation by gender in London, 2025
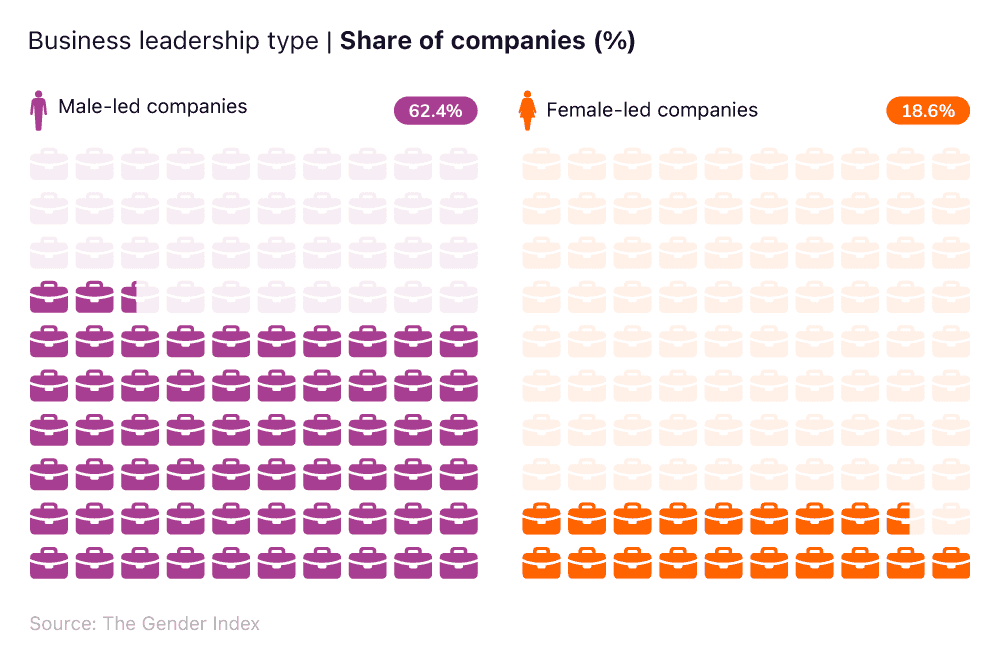
This means male-led companies made up more than three times the share of female-led companies. Put another way, fewer than one in five companies in London were female-led, while close to two-thirds were male-led.
The figures show that female-led businesses remained significantly underrepresented compared with male-led businesses in London.
Looking for help starting your own business? Find the best deals available on business start-up loans alongside expert guidance on how to write a business plan and how to fund your business idea.
What are the biggest companies in the UK in 2025?
What are the biggest industries in the UK?
The latest UK business statistics found that HSBC had the highest market cap of any UK company in 2026, with the bank valued at £230.12 billion.
Market capitalisation, commonly shortened to market cap, is the total value of a publicly listed company’s shares. It’s calculated by multiplying the company’s share price by the number of shares in issue.
HSBC’s market cap was almost a tenth higher than AstraZeneca’s (8.3%). The pharmaceutical company had the second-highest market cap in the UK, at £212.45 billion.
Top 10 biggest companies in the UK by market cap, May 2026
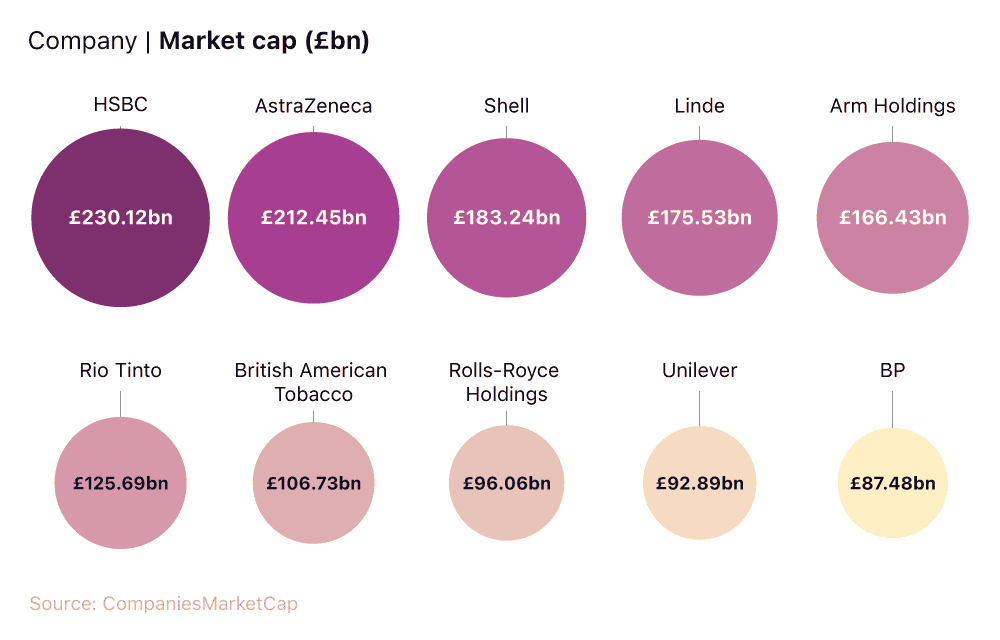
Three other companies surpassed the £160 billion mark as of May 2026, including oil and gas company Shell (£183.24 billion), chemical company Linde (£175.53 billion), and semiconductor company Arm Holdings (£166.43 billion).
In tenth position was BP, with a market cap of £87.48 billion. This was almost two-thirds lower than the UK’s biggest company, HSBC (62%).
What is the average business revenue?
Industry-revenue statistics show that fuel wholesaling is the highest-revenue industry in the UK in 2026-27, generating £415.5 billion. This is more than double the revenue of supermarkets, which ranked second at £205.4 billion.
Top 10 biggest industries in the UK by revenue, 2026-27
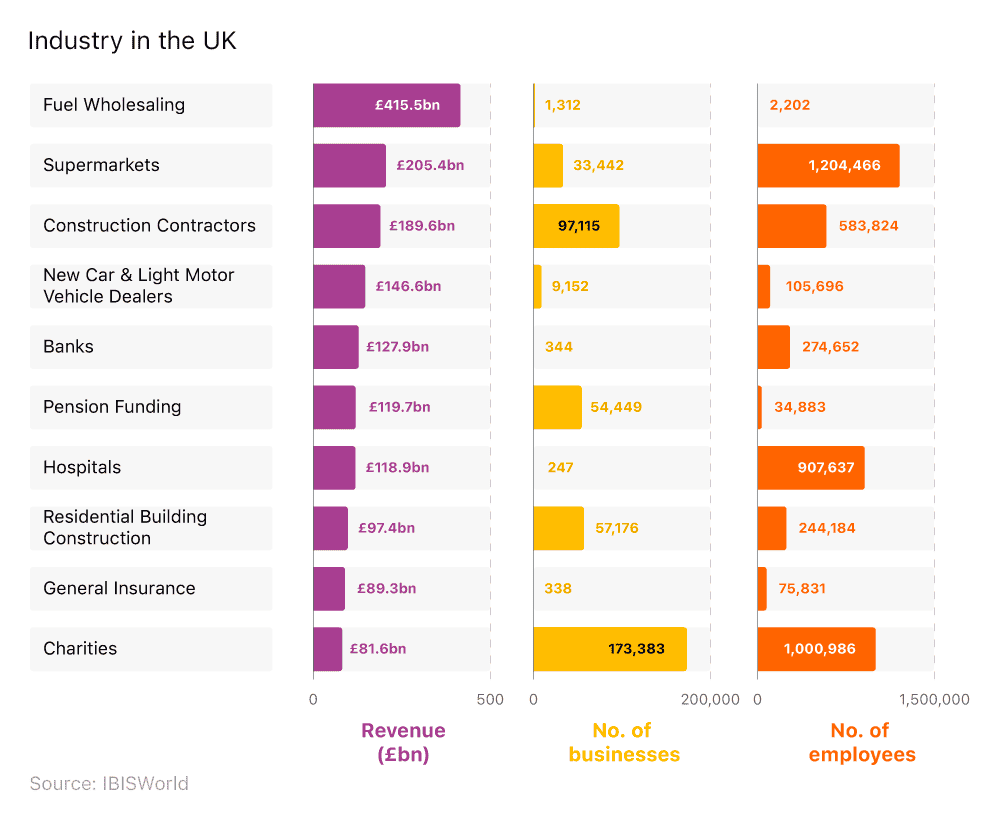
The next biggest industries by revenue were:
Construction contractors (£189.6 billion).
New car and light motor vehicle dealers (£146.6 billion).
Banks (£127.9 billion).
This means the top five industries each expected to generate more than £125 billion in revenue in 2026-27.
Fuel wholesaling stands out because it’s forecast to generate the highest revenue with only 1,312 businesses and 2,202 employees. This equates to an average revenue of around £316.7 million per business.
By comparison, supermarkets generate £205.4 billion and employ more than 1.2 million people, showing how different industries can produce high revenues in notably different ways.
UK business FAQs
As of 2025, the UK business population consisted of approximately 5.69 million businesses. These businesses employed around 28.1 million people, according to UK Government business population estimates.
While exact first-year business failure rates vary, business closures remain common in the UK. In the first quarter (January to March) 2026 alone, there were 83,195 business closures recorded across the country. Many businesses fail within their first few years due to factors such as cash flow issues and market competition.
Construction is the biggest business sector in the UK by number of businesses, with approximately 885,485 registered businesses operating in the industry in 2025.
In May 2026, HSBC ranked as the largest company in the UK based on market capitalisation, reaching an estimated value of £230.12 billion. The company remains one of the most valuable financial institutions in Europe.
In 2025, SMEs make up approximately 99.2% of all UK businesses, accounting for around 5.68 million companies.
The cost of business insurance can vary substantially depending on the size of your business, the industry, and the type of risks involved for employees during their day-to-day work.
Across the UK, 13.2% of active high-growth companies were female-led in 2025. In London, 18.6% of companies were female-led, meaning women-led businesses still represented fewer than one in five companies.
Artificial intelligence is becoming a much bigger business risk. In 2025, one in 10 businesses (10%) cited AI as a key risk, rising to almost a third (32%) in 2026. This means AI moved from a relatively minor concern to one of the top business risks.
At the start of 2025, there were around 5.7 million private-sector businesses in the UK. This includes businesses of all sizes, from sole traders and small businesses to large employers.
Methodology and sources
The historical datasets were first structured into pandas DataFrames and organised by year or quarter, along with the relevant business indicators.
To generate money.co.uk future projections, a Linear Regression model was applied separately to each variable. Linear regression was chosen because the task involved estimating short-term directional trends from limited historical data. This approach ensures the projections remain simple, transparent, and reproducible.
In this process, Scikit-learn’s Linear Regression was used to fit the historical data points and forecast values for future years or quarters.
https://www.gov.uk/government/statistics/business-population-estimates-2025
https://companiesmarketcap.com/gbp/united-kingdom/largest-companies-in-the-uk-by-market-cap/
https://thegenderindex.co.uk/uploads/Reports/TGI-2026-report.pdf
https://www.statista.com/statistics/291488/uk-sme-growth-by-sector/
https://www.statista.com/statistics/291401/uk-profitable-smes-by-sector/
https://www.statista.com/statistics/291239/uk-sme-business-performance/
https://www.ukfinance.org.uk/system/files/2026-03/Business%20Finance%20Review%202025%20Q4.pdf
https://www.grandviewresearch.com/horizon/outlook/e-commerce-market/uk
https://www.trade.gov/country-commercial-guides/united-kingdom-ecommerce
https://thegenderindex.co.uk/uploads/Reports/TGI-2026-report.pdf
https://thegenderindex.co.uk/uploads/Reports/TGI-2026-report.pdf
https://companiesmarketcap.com/gbp/united-kingdom/largest-companies-in-the-uk-by-market-cap/
https://www.ibisworld.com/united-kingdom/industry-trends/biggest-industries-by-revenue/

About Joe Phelan
Joe is an experienced writer, journalist and editor. He has written for the BBC, National Geographic, and the Observer. As a business expert, his work frequently spotlights the ventures and achievements of small business owners. He writes a weekly insight article for money.co.uk, published every Tuesday.
View Joe Phelan's full biography here (opens in a new tab) or learn more about our editorial policy (opens in a new tab)