UK small business statistics 2026

We’ve collated the latest UK small business statistics for 2026, including the number of SMEs in the UK, the evolution of the SME market, and what this means for the average profit margins of small businesses across the country.
Small and medium-sized enterprises (SMEs) are an integral part of the UK economy. Representing more than 99% of all UK businesses, they employ around three in every five workers across the country and contribute more than half of all business turnover from the private sector.
Like other businesses, SMEs have faced uncertain economic times in recent decades, marked by financial recessions, the global COVID-19 pandemic, the cost-of-living crisis, and various geopolitical events.
With this in mind, money.co.uk has compiled the latest small business statistics for 2026 to illustrate the current economic landscape for SMEs in the UK, how these trends have evolved, and suggest what the future may hold for these cornerstones of the UK economy.
Top 10 must-know UK small business statistics for 2026
There are approximately 5.68 million SMEs in the UK, accounting for 99.85% of all businesses.
The number of small businesses in the UK grew by approximately 1.2 million between 2010 and 2024.
Construction has more SMEs than any other UK industry, with over 885,000.
London has the most SMEs of all UK regions relative to its population (1,432 per 10,000 adults).
SMEs employ around 60% of the UK workforce.
Roughly 14% of UK SMEs with employees are led by women.
Around 6% of UK SMEs are led by a managerial team where at least half are from an ethnic minority background.
SMEs contribute roughly 51% of total UK business turnover to the private sector, an estimated £2.8 trillion.
The median annual revenue for SMEs with employees in the UK is £300,000.
The average cost of business electricity was 23.99p per kWh in 2025, when including the Climate Change Levy (CCL).
Number of SMEs in the UK
How many small businesses are there in the UK?
According to the latest UK business statistics, there were almost 5.7 million private sector businesses in the UK as of 2025, with 99.85% considered SMEs (roughly 5.68 million).
To qualify as an SME, your business must have fewer than 250 employees and a turnover below €50 million (or a balance sheet total no greater than €43 million).
The overwhelming majority of UK businesses (99.2%) are classed as micro or small businesses (i.e., those with 0 to 49 employees).
Number of UK businesses by size
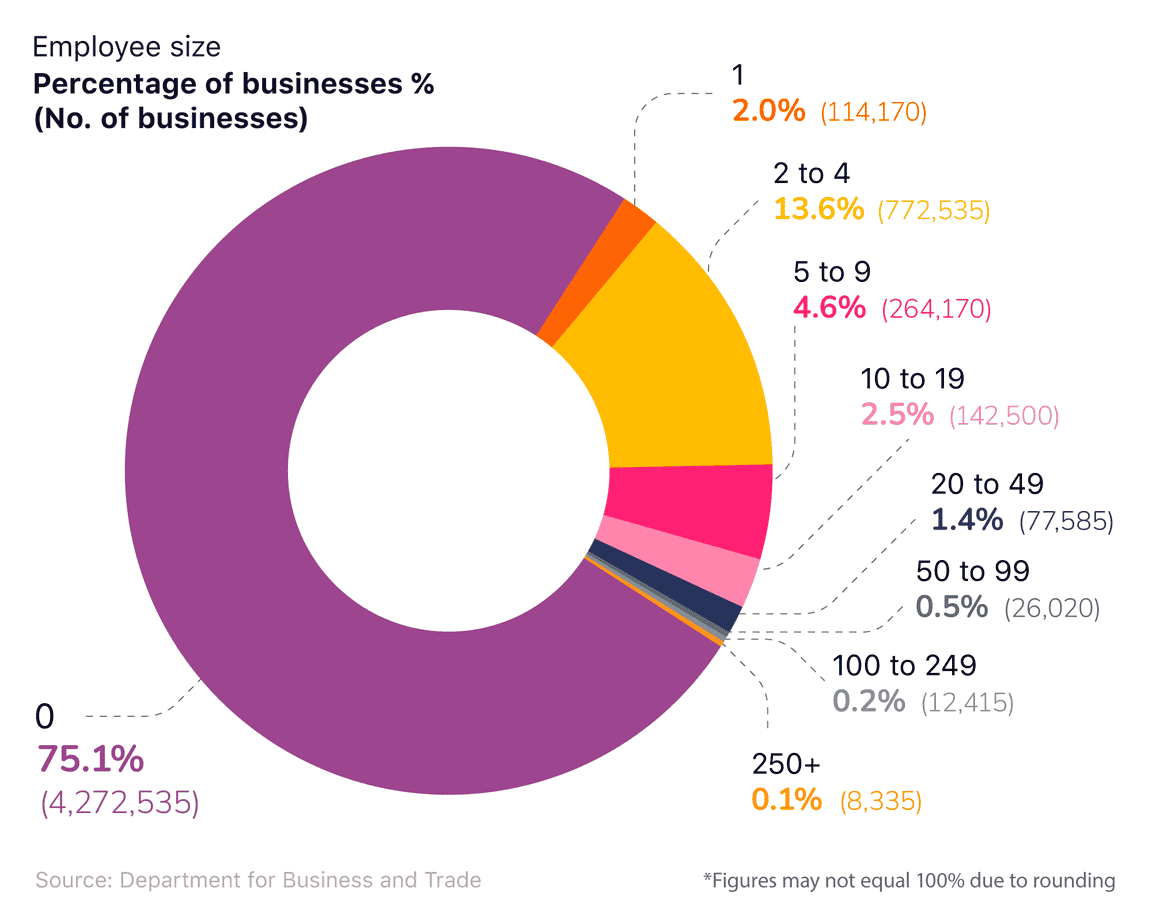
Small business stats from the UK government indicate that over 75% of UK companies have zero employees, with 13.6% having between two and four people on their books.
The growth in the number of UK SMEs
The number of small businesses in the UK grew consistently between 2010 and 2020, increasing by a third across the decade to a peak of six million in 2020.
Number of UK SMEs over time
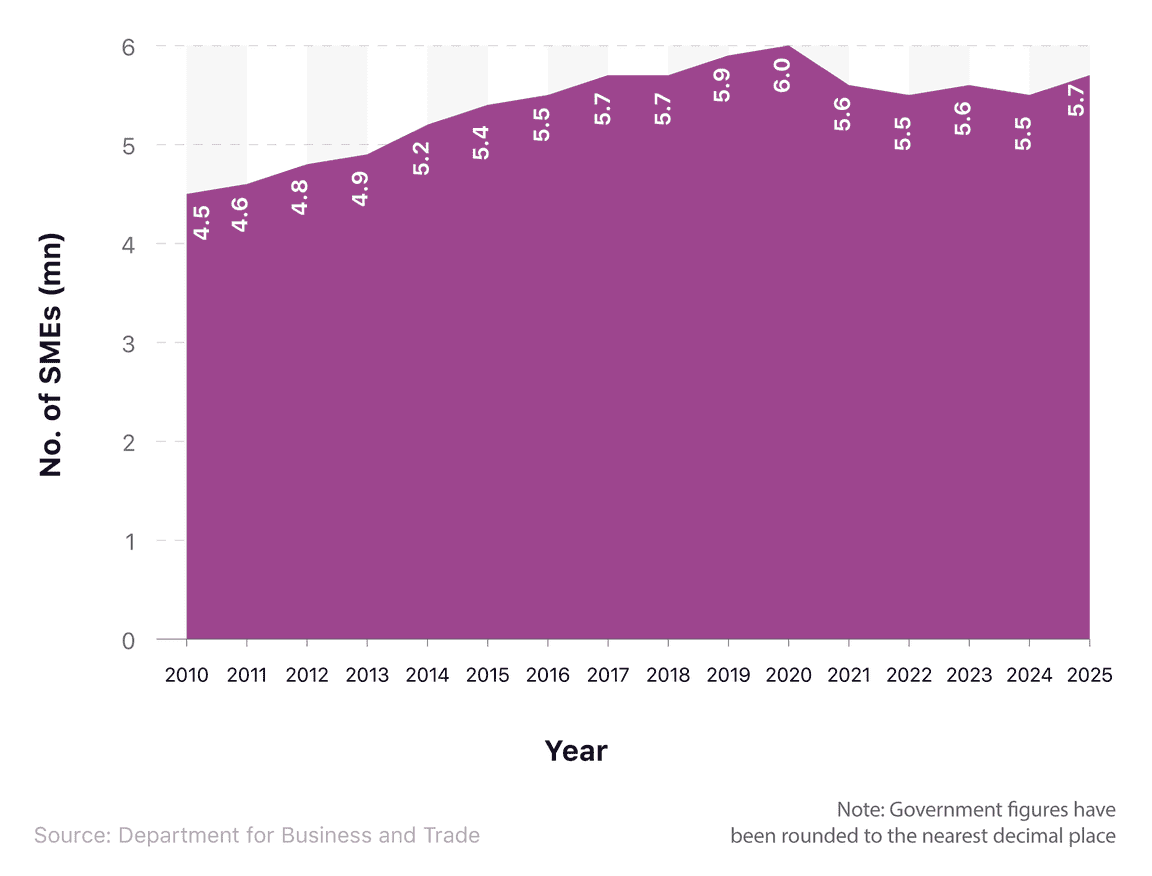
Since the COVID-19 pandemic, the number of SMEs in the UK has fluctuated between 5.5 and 5.7 million. The latest figure of 5.7 million for 2025 marks the highest total since 2020.
Number of UK SMEs over time by size of business
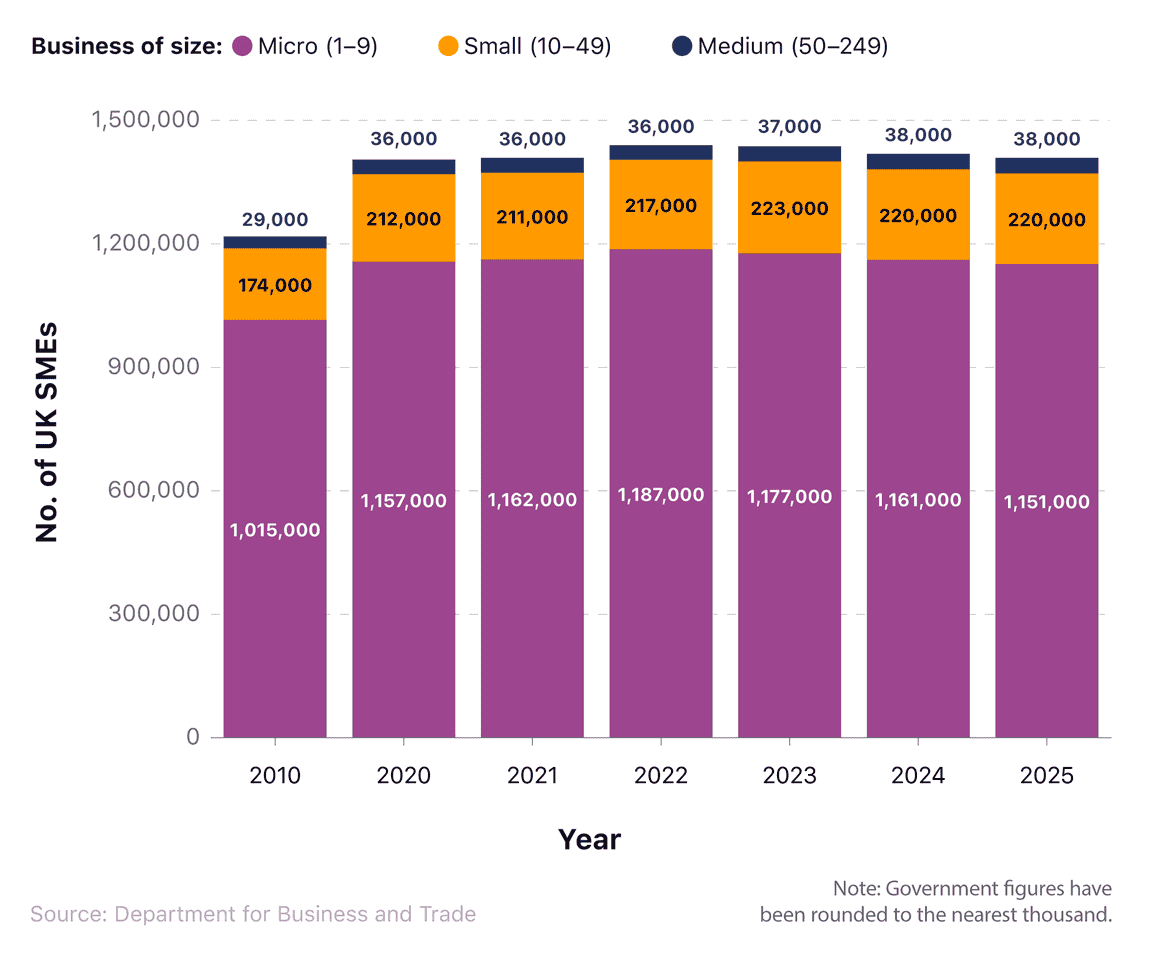
Small business statistics from the Department for Business and Trade reveal that, between 2010 and 2025, the number of:
Micro-businesses (one to nine employees) grew by 13.4% to 1.51 million.
Small businesses (10 to 49 employees) increased by 26.4% to 220,000.
Medium-sized businesses (50 to 249 employees) expanded by 31% to 38,000.
Which industries have the most SMEs in the UK?
The most recent small business report from the UK government indicates that the construction industry has more SMEs than any other sector.
At over 885,000, this equates to around 15.6% of the UK’s total number of SMEs. This is more than three times the total for manufacturing, another major industrial sector, highlighting the scale of the UK's construction industry.
Professional, scientific, and technical activities had the next highest number of SMEs, at 819,465. This was over 270,000 more than Wholesale and Retail trade (the third highest industry), making the sector the only other one with more than 600,000 SMEs.
Number of SMEs in the UK by industry
| Industry | Number of businesses | Percentage of businesses with 0 employees (%) | Percentage of businesses with 1 to 49 employees (%) | Percentage of businesses with 50 to 249 employees (%) |
|---|---|---|---|---|
| Construction | 885,485 | 78.1 | 21.6 | 0.2 |
| Professional, scientific, and technical activities | 819,465 | 77.2 | 22.2 | 0.5 |
| Wholesale and Retail trade; Repair of motor vehicles and motorcycles | 548,515 | 55.8 | 43.1 | 0.9 |
| Administrative and support service activities | 474,780 | 74.3 | 24.5 | 0.9 |
| Human health and social work activities | 397,995 | 83.9 | 14.8 | 1.1 |
| Other service activities | 376,080 | 81.9 | 18 | 0.1 |
| Information and communication | 353,035 | 78.2 | 20.9 | 0.7 |
| Transportation and storage | 328,960 | 86.2 | 13.1 | 0.5 |
| Education | 312,735 | 92.8 | 6.9 | 0.3 |
| Arts, entertainment, and recreation | 277,185 | 89.5 | 10.1 | 0.3 |
| Manufacturing | 263,085 | 68 | 29.3 | 2.3 |
| Accommodation and food service activities | 233,080 | 37.5 | 60.7 | 1.4 |
| Real estate activities | 154,770 | 65.5 | 34.1 | 0.3 |
| Agriculture, forestry, and fishing | 147,460 | 66 | 33.6 | 0.3 |
| Financial and insurance activities | 89,235 | 73.1 | 25.2 | 1.1 |
| Mining and quarrying; Electricity, gas and air conditioning supply; Water supply; sewerage, waste management, and remediation activities | 28,395 | 67.8 | 30 | 1.6 |
Source: Data from the Department for Business and Trade’s Business population estimates 2025 official statistics, Business population estimates for the UK and regions 2025: detailed tables (MS Excel), Table 4
Conversely, there were just 28,395 SMEs in the mining and quarrying industry as of 2024. This represented the smallest number across all sectors (around 0.5% of all SMEs in the UK).
Percentage of UK SMEs per industry
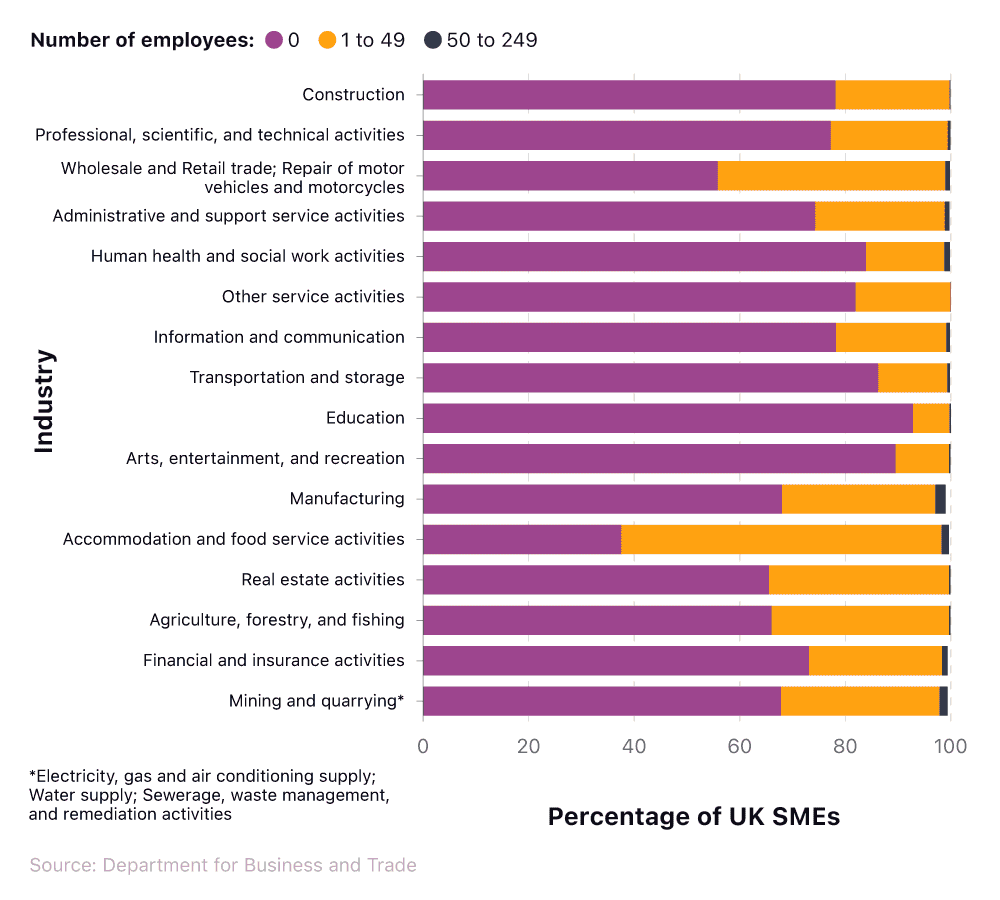
According to the latest small business statistics from the UK government, 100% of companies from the education sector and other service activities in 2025 were classed as SMEs.
The data suggests that:
Over 92% of businesses from the education industry had zero employees compared to just 37.5% from accommodation and food service activities.
Almost 61% of those employed in the accommodation and food service sector were for companies with one to 49 registered workers. This was contrasted with less than 7% for education and just over 10% for arts, entertainment, and recreation jobs.
The manufacturing sector had the highest percentage of SMEs with between 50 and 249 employees, at 2.3%.
Number of SMEs in the UK by region
According to small business statistics from the Department for Business and Trade, London has the highest number of SMEs in relation to its population, with 1,432 per 10,000 adults.
This is almost twice the rate for the North East and was the only UK region to register more than 1,200 SMEs per 10,000 adults in 2025.
Number of small businesses in each region of the UK per 10,000 adults
| Region/country | Number of adults (millions) | Number of SMEs with 0 employees per 10,000 residents (thousands) | Number of SMEs with 1 to 49 employees per 10,000 residents (thousands) | Number of SMEs with 1 to 49 employees per 10,000 residents(thousands) | Number of SMEs employees per 10,000 residents (thousands) |
|---|---|---|---|---|---|
| United Kingdom | 56 | 766 | 246 | 7 | 1,019 |
| England | 47 | 801 | 253 | 7 | 1,061 |
| Wales | 3 | 533 | 203 | 5 | 741 |
| Scotland | 5 | 581 | 198 | 5 | 784 |
| Northern Ireland | 2 | 651 | 247 | 7 | 905 |
| North East | 2 | 561 | 177 | 5 | 743 |
| North West | 6 | 591 | 224 | 7 | 822 |
| Yorkshire and the Humber | 5 | 665 | 222 | 6 | 893 |
| East Midlands | 4 | 749 | 227 | 7 | 983 |
| West Midlands | 5 | 681 | 230 | 6 | 917 |
| East of England | 5 | 835 | 259 | 7 | 1,101 |
| London | 7 | 1,080 | 342 | 10 | 1,432 |
| South East | 8 | 868 | 258 | 7 | 1,133 |
| South West | 5 | 908 | 247 | 6 | 1,161 |
Source: Data from the Department for Business and Trade’s Business population estimates 2025 official statistics, Business population estimates for the UK and regions 2025: detailed tables (MS Excel), Table 8
Wales registered the fewest number of small businesses in 2025 compared to its population (741 per 10,000 adults), followed closely by the North East (743 per 10,000 adults).
Even beyond London, the South had substantially more SMEs per 10,000 adults than the North, with the South West’s and South East’s totals of 1,161 and 1,133 representing the second and third highest regional totals, respectively.
Percentage of UK SMEs by region
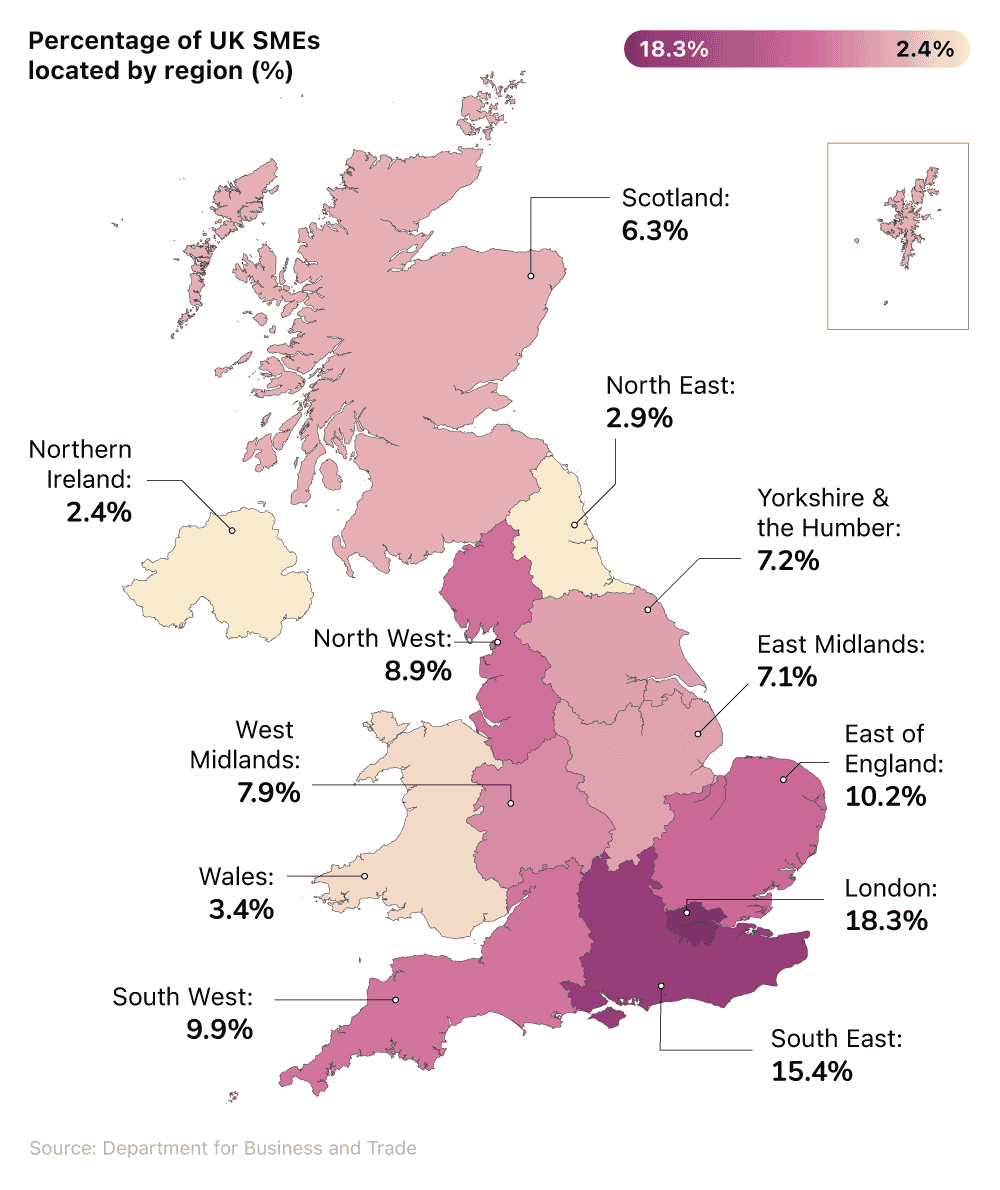
London has the largest portion of UK SMEs, occupying 18.3% of the overall total, followed by the South East (15.4%). This means that London and the South East account for over a third (33.7%) of all UK SMEs combined.
At the other end of the scale, less than 3% of the UK’s SMEs are based in Northern Ireland (2.4%) or the North East of England (2.9%), making these the regions with the lowest proportion of SMEs.
Data from the Department for Business and Trade also shows that:
More than a tenth of UK SMEs are found in the East of England, the third highest of any region.
SMEs are more than twice as likely to be found in the South of England than in the North (43.6% vs. 19%, respectively).
There are more SMEs in London than in Scotland, Wales, and Northern Ireland combined.
New business incorporation statistics
Small business statistics from money.co.uk revealed that London had the largest number of newly incorporated businesses of any region in 2025, with a total of 253,720. This represents a rise of over 72% from 2024, accounting for over a third (33.72%) of the UK total.
The South East had the next highest total, with 80,417 new companies formed in 2025 – up 38.77% year-on-year. However, this was less than a third of the London total, meaning the South East accounted for 10.69% of all new companies in 2025.
The number of newly incorporated companies in the UK by year and region
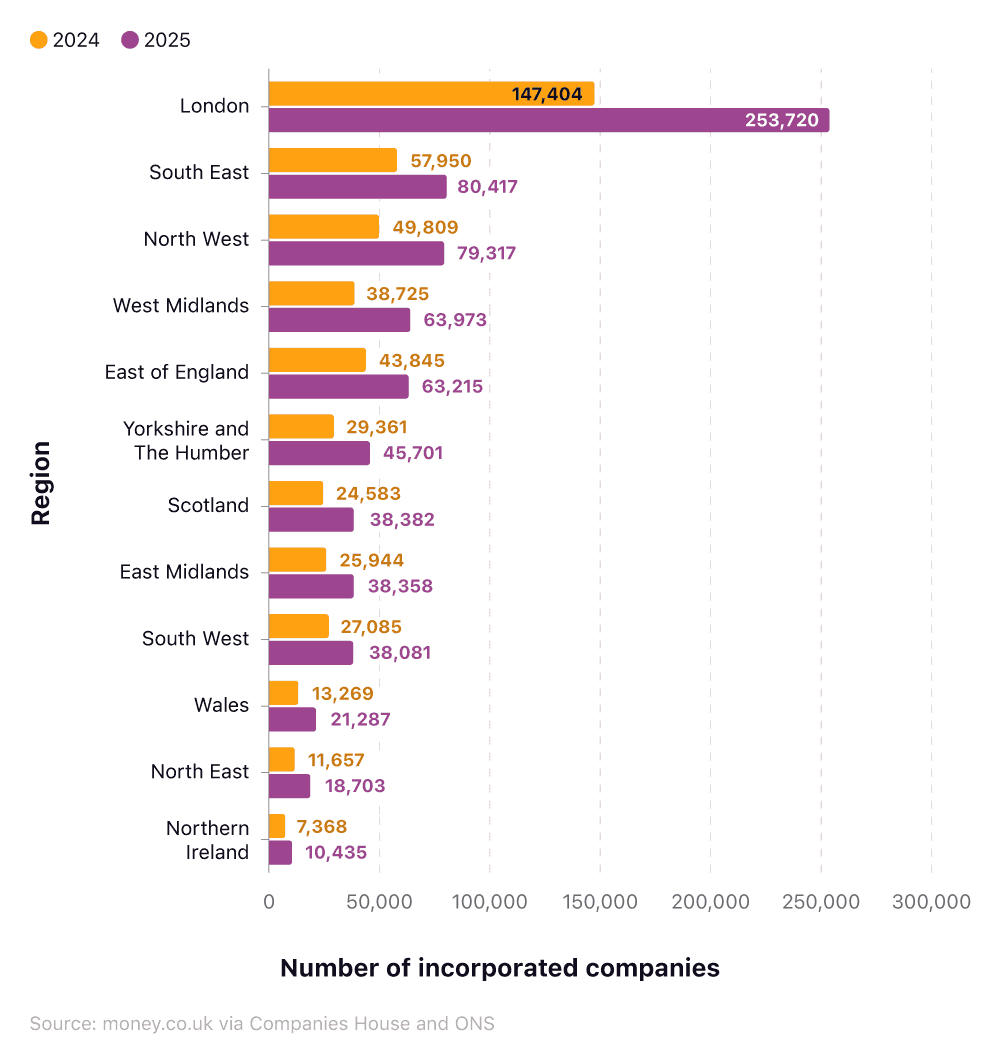
The North West rounded off the top three, with 79,317 new companies in 2025. This marked a rise of over 59% from 2024, making the North West the final region to account for over a tenth of new UK companies.
At the other end of the scale, Northern Ireland’s total of 10,435 new companies made up just 1.39% of the national total. However, despite these relatively low numbers, Northern Ireland saw a rise of 41.63% from 2024, when the number was below 7,400.
Every UK region saw its number of new company incorporations grow between 2024 and 2025, with London seeing the biggest gains overall.
Number of new company incorporations in the UK by year
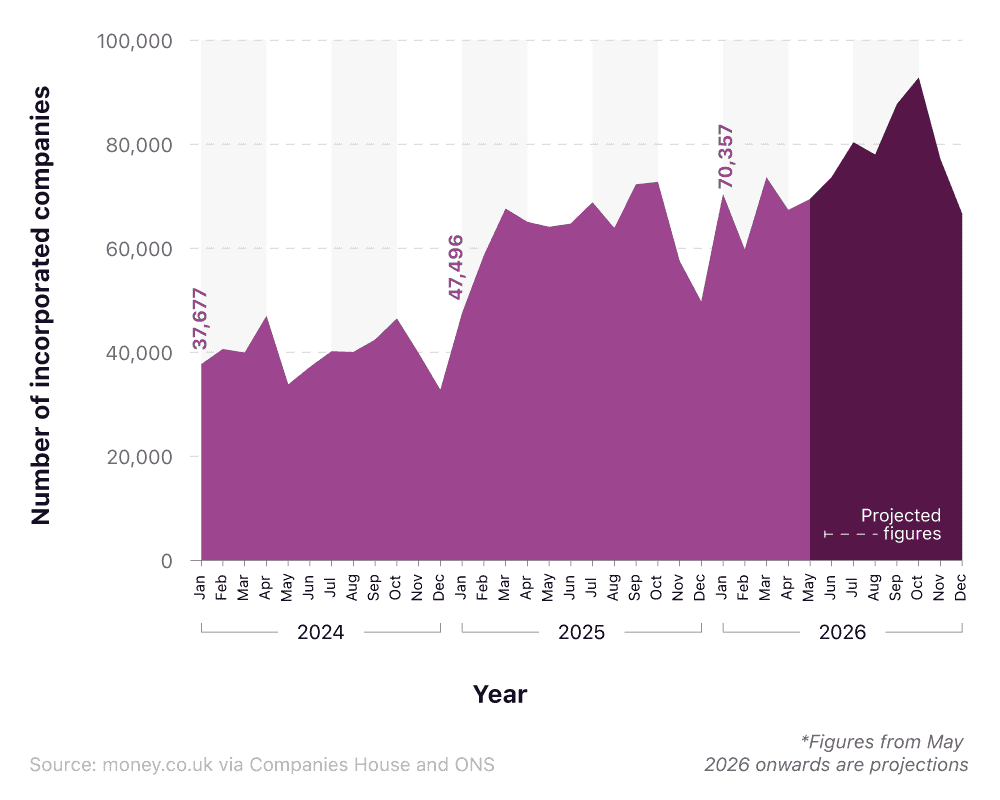
The number of new company incorporations has been on a largely upward curve since January 2024, when the total stood at 37,677. After reaching close to 47,000 in April 2024, the total would fall by over 13,000 the following month before surpassing 46,000 again in October.
Numbers would accelerate in the first part of 2025, reaching 58,575 in February before exceeding 67,000 in March. The annual peak would occur in October, when new incorporations reached 72,739, before falling below 50,000 by December.
Projections for 2026 look set to follow a similar pattern, albeit at higher levels, based on analysis from money.co.uk. October is anticipated to be the month with the highest number of new companies formed, with a projected total of 92,779, with this figure expected to fall below 67,000 by December.
It’s worth noting that new company incorporations capture all new registered entities, including those that may not trade commercially, such as property management companies, special purpose vehicles (SPVs), and dormant companies. Therefore, incorporation figures provide an indication of company formation activity rather than a direct measure of the number of new businesses entering the UK economy.
UK SME population statistics
How many people are employed by small businesses in the UK?
In all, UK SMEs employed around 16.9 million people in 2025, up 1.5% from 2024 when the total was 16.6 million. This equated to around 60% of the UK’s workforce.
Businesses in the government's "no employees" category account for around 4.7 million people in employment. This group is primarily made up of self-employed sole traders and owner-managed businesses, but also includes certain incorporated businesses where a single PAYE worker is treated as equivalent to a working proprietor under the Department for Business and Trade’s methodology.
Share of UK employment by business size
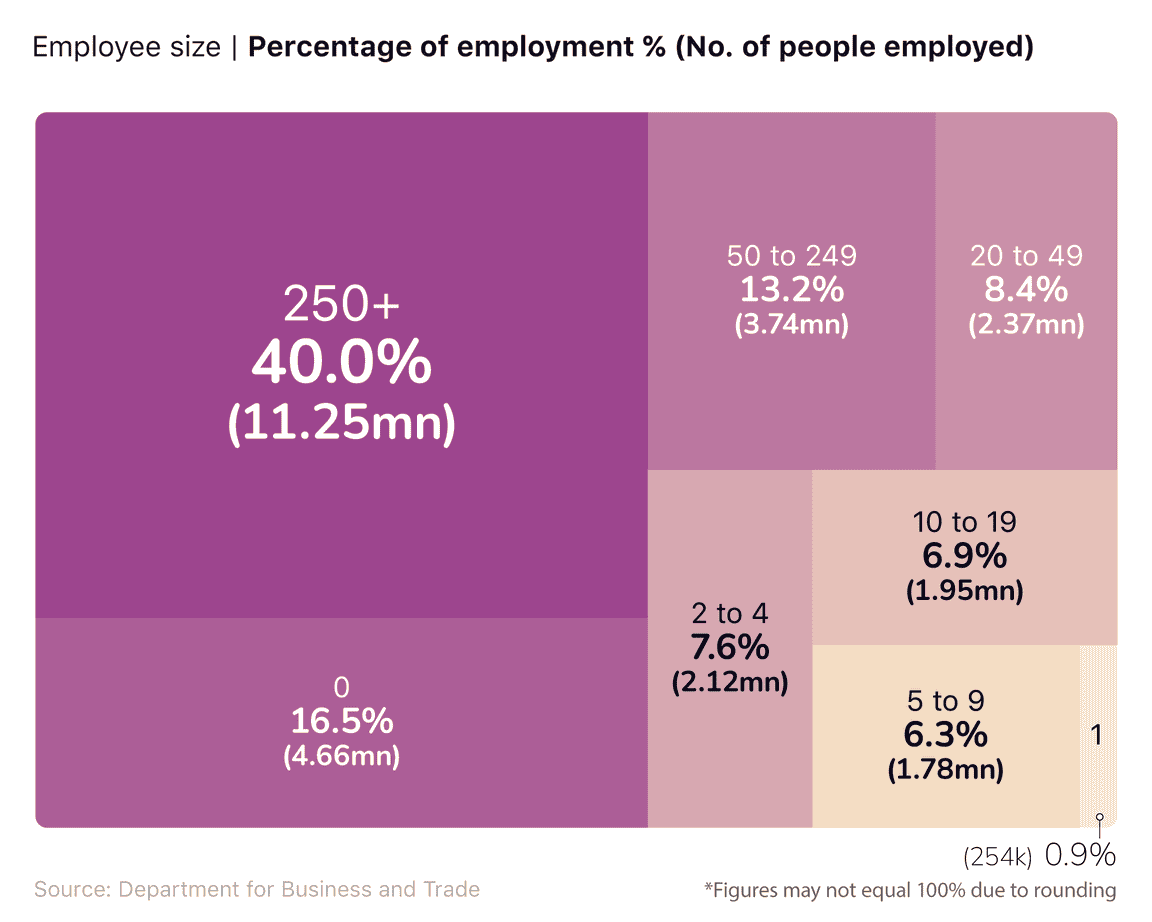
This is followed by businesses with 50 to 249 workers, who employ around 3.74 million people. This equates to 13.2% of all private sector employment in the UK.
Number of people employed by UK SMEs over time by business size
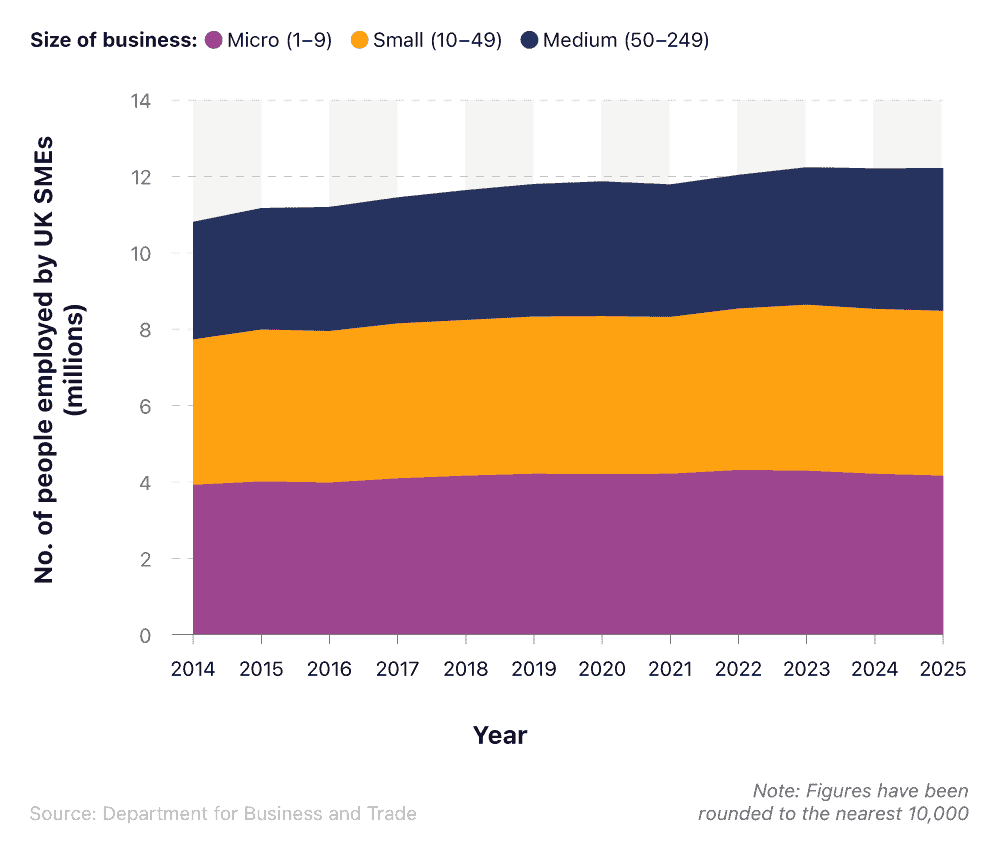
Small business statistics from the Department for Business and Trade reveal that, between 2014 and 2025, the number of people employed by:
Micro-businesses (those with 1 to 9 employees) grew by 5.9% to 4.16 million.
Small businesses (10 to 49 employees) increased by 13.6% to 4.32 million.
Medium-sized businesses (50 to 249 employees) expanded by 21.6% to 3.74 million.
Women in SME statistics
According to the latest diversity in business statistics, approximately 14% of SME employers were led by women in 2024. This was a drop of four and five percentage points, respectively, from 2022 and 2021. By contrast, 30% of businesses with no employees were female-led in 2024, up from 18% in 2023.
Findings from the Longitudinal Small Business Survey also indicate that 26% of UK SMEs with employees had an equal management team of men and women in 2024, a rise of one percentage point from the previous year.
Incidentally, those entirely led by men fell slightly from 44% to 43% between 2023 and 2024.
This is supported by research from the GEM Consortium, which discovered that the level of early-stage entrepreneurial activity by women in the UK tripled between 2002 and 2024 (3.5% to 10%).
In 2024, the ratio of women to men in early-stage entrepreneurial activities stood at 69%, marking a decline of 16 percentage points from the previous year, when the total was 85%. However, this still represents a significant climb from 1999, when the figure was just 41%.

A selection of reports from NatWest found:
There were approximately 164,000 female-led businesses founded across the UK in 2023 – up 4% from 2022 and 26% higher than in 2019.
Just over a fifth (20.5%) of new incorporations were all-female-led in 2022 (a rise from 16% in 2018).
The biggest increase was among those aged 16 to 25 (+24.3% from 2018).
Four in five women surveyed did not feel confident about future economic growth, with a third expecting their businesses to shrink over time.
Almost half of those questioned believed fundraising would become more difficult with time.
An estimated £250 billion could be added to the UK economy if women and men were equal in their ability to start up and scale businesses.
Percentage of female-led SMEs with employees
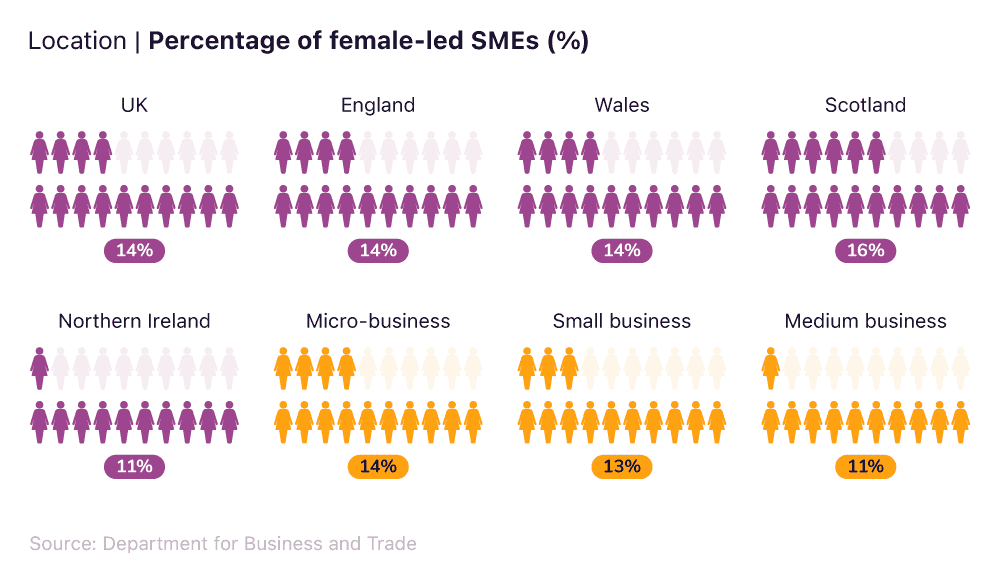
Scotland has the highest rate of female-led SME employers, with a total of 16% in 2024 – two percentage points more than both England and Wales.
Northern Ireland’s total of 11% made it the only UK country to fall below the collective average of 14%. The prevalence of female-led SMEs falls as company size increases, with 14% of micro-businesses run by women compared to just 11% for medium-sized companies.
Start-up business loans are a great way to kickstart your business, provide a financial boost for your company, and help scale your SME with confidence.
Ethnic diversity statistics in UK SMEs
Latest results from the UK’s Small Business Survey show that in 2024, around 6% of SME employers were led by a management team where at least 50% were from an ethnic minority group. This represents a fall from 2023, when the total stood at 7%.
Ethnic diversity of UK SMEs
| Ethnic group | Percentage |
|---|---|
| White British (including white English, Scottish, Welsh, or Northern Irish) | 81% |
| White Irish | 2% |
| Any other White background | 5% |
| Mixed White and Black Caribbean | 1% |
| Mixed White and Black African | Less than 1% |
| Mixed White and Asian | Less than 1% |
| Any other Mixed background | 1% |
| Indian | 1% |
| Pakistani | Less than 1% |
| Bangladeshi | Less than 1% |
| Any other Asian background | 1% |
| Black Caribbean | Less than 1% |
| Black African | Less than 1% |
| Any other Black background | Less than 1% |
| Chinese | Less than 1% |
| Arab | Less than 1% |
| Other | 1% |
| Don't know | Less than 1% |
| Refused | 5% |
Source: Data from Department for Business and Trade’s Small Business Survey 2024: businesses with employee official statistics, Longitudinal Small Business Survey 2024: SME Employers - data, Table 32
UK small business revenue and profit statistics
UK SMB market statistics
At the start of 2025, there were 5.64 million small businesses in the UK (i.e., those with 0 to 49 employees). This accounted for around 99.2% of all companies across the country, 47% of employment, and 34% of turnover from the private sector.
In the same year, total UK SME employment figures stood at 16.9 million, with an estimated turnover of £2.8 trillion.
What is the average revenue for a small business in the UK?
According to small business statistics from the Department for Business and Trade, the median annual revenue (turnover) for a UK SME in 2024 stood at £300,000, with the mean revenue almost five times higher at £1.49 million.
Average revenue for small businesses in the UK
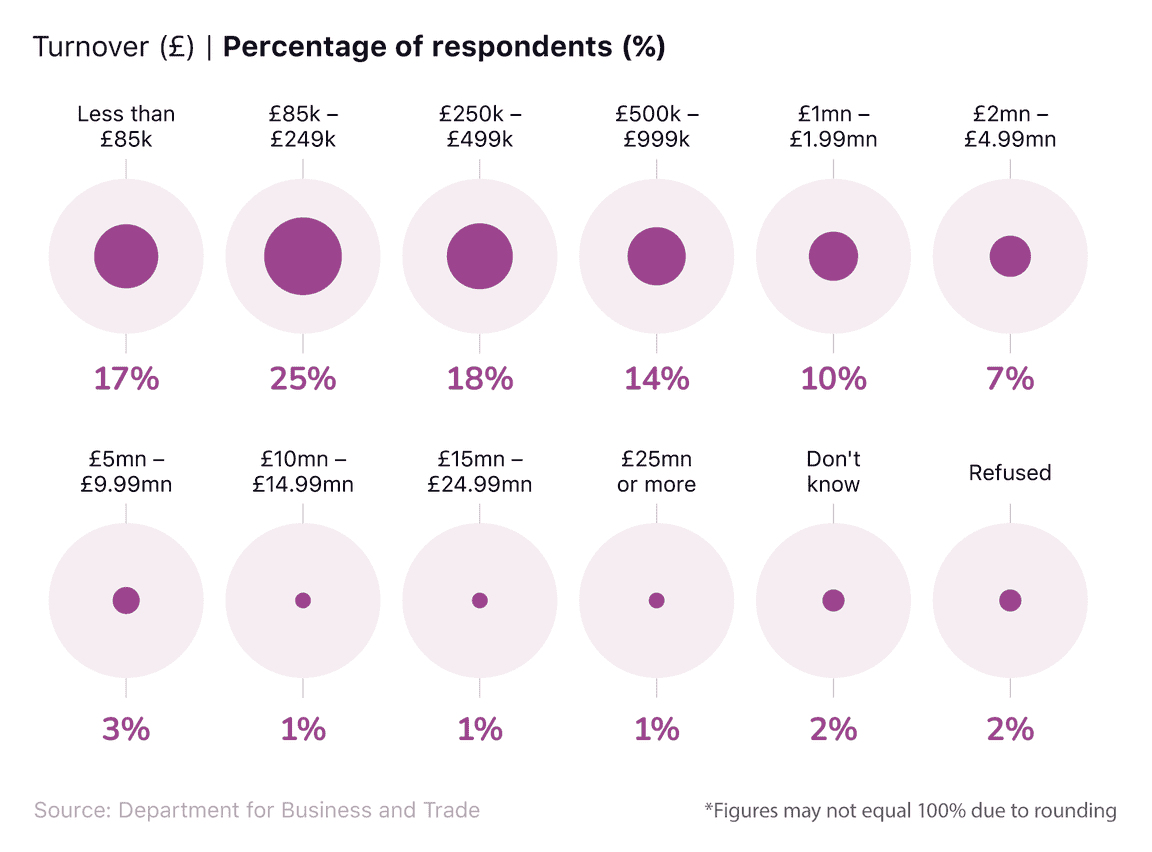
The UK Government’s 2024 Small Business Survey reveals that a quarter of SMEs generated between £85k and £249k throughout the year, compared to 14% who earned between £500k and £999k.
Generally speaking, as average turnover increases, the percentage of SMEs earning that amount tends to decrease, with just 3% of UK SMEs reporting an average revenue of £10 million or more throughout 2024.
The revenue trajectory of SMEs with employees over the previous 12 months, 2024
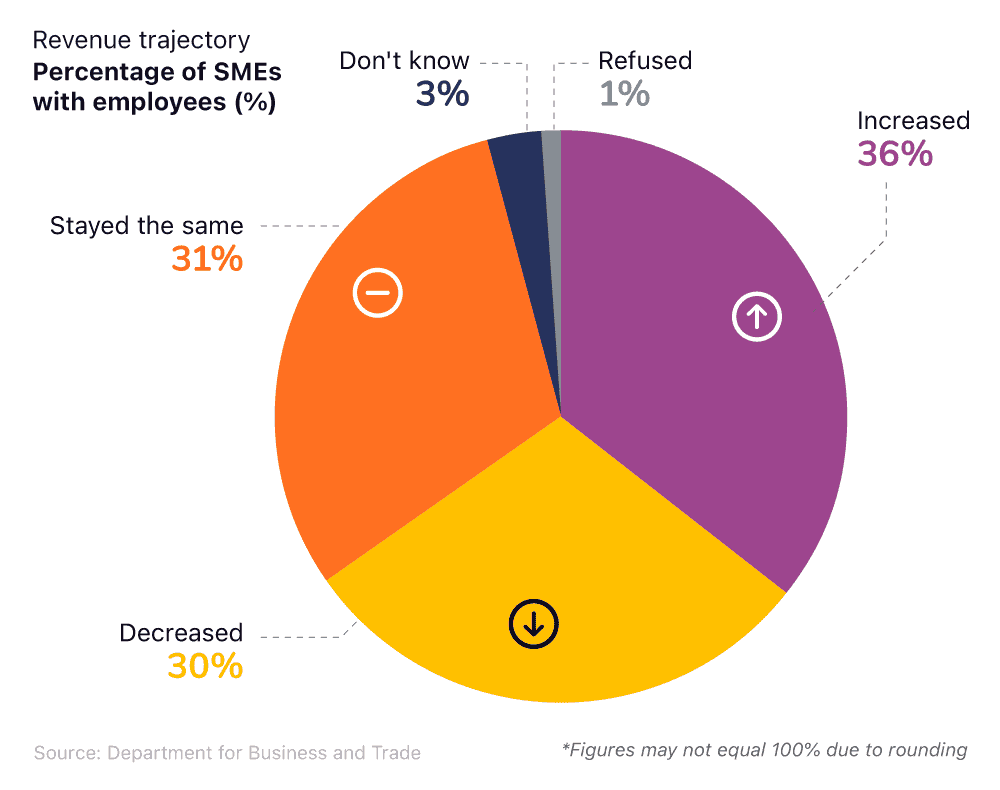
Among SMEs with employees, 36% of companies reported that their revenue increased over the previous 12 months in 2024, compared to just 30% who saw decreases.
A similar number (31%) claimed their revenue figures had remained largely unchanged between 2023 and 2024, highlighting the diverse split in revenue trajectory across the SME landscape.
What is the average profit for a small business in the UK?
Contribution of total UK business turnover by company size
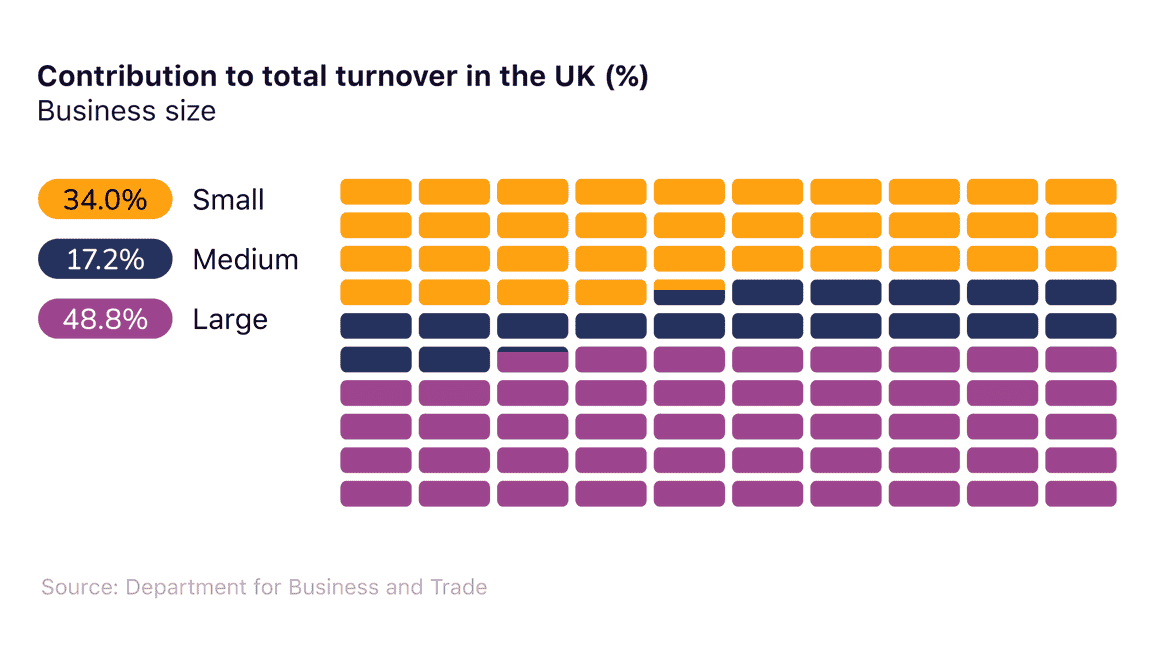
As of 2025, small businesses contributed more than a third (34%) of total business turnover in the UK, almost double the proportion from medium-sized businesses.
Incidentally, just under 49% of the UK business revenue for the year came from large companies (those with 250 or more employees).
UK SME turnover statistics by business size
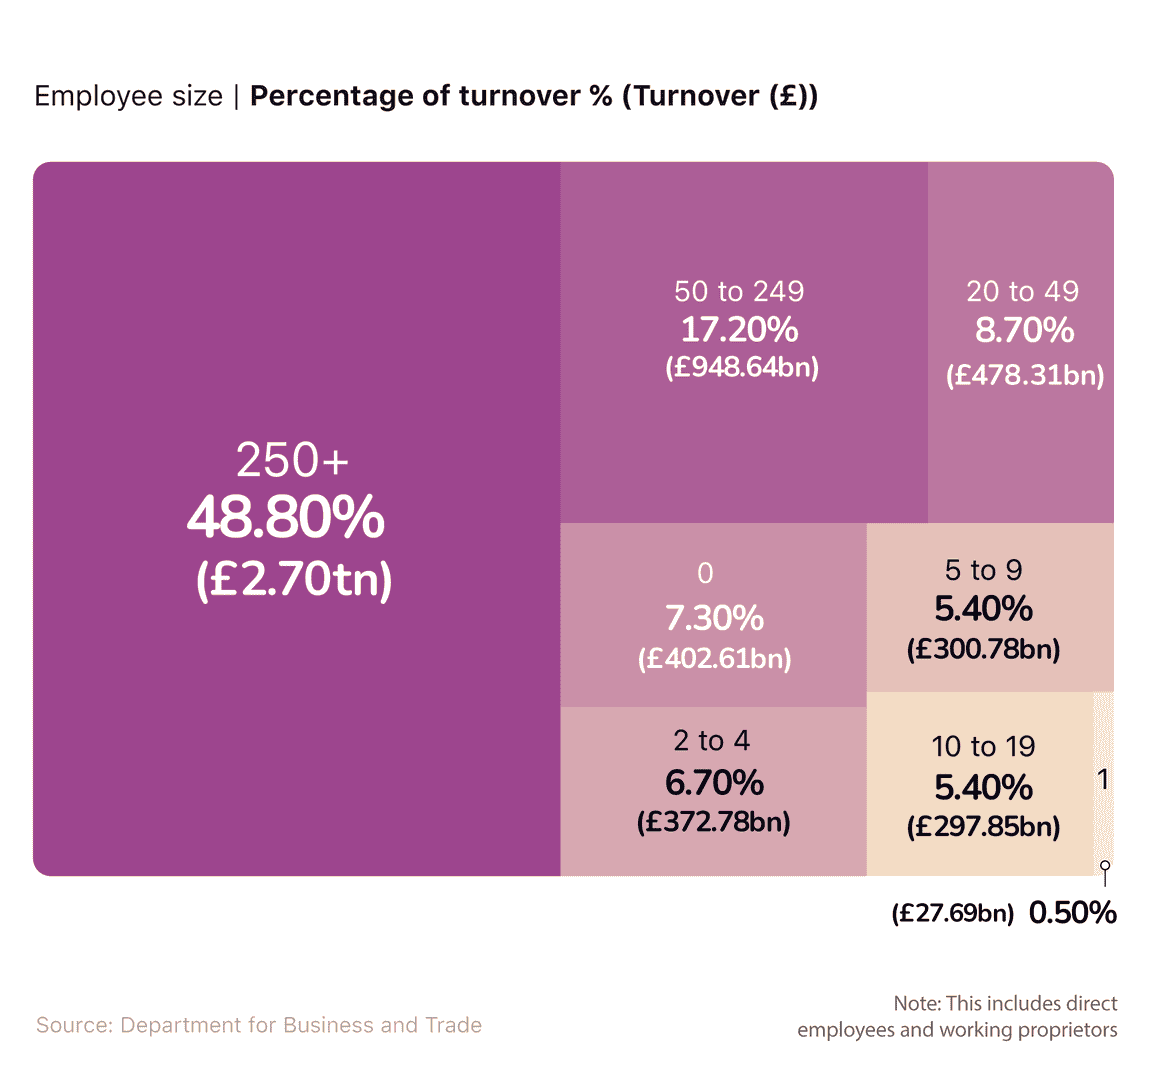
According to small business stats from the UK government, SMEs contributed more than half (51.2%) of total business turnover in 2024, to the tune of around £2.8 trillion.
Of the total generated by UK businesses in 2024, 17.2% came from companies that employed between 50 and 249 people (more than double the contribution from those with zero employees).
What is the average profit for a small business in the UK?
The average profit for a small business in 2024 stood at £70,000.
Generally speaking, as the number of employees within a business increases, so does the typical profit it makes.
Median annual profit for SMEs in the UK, 2024
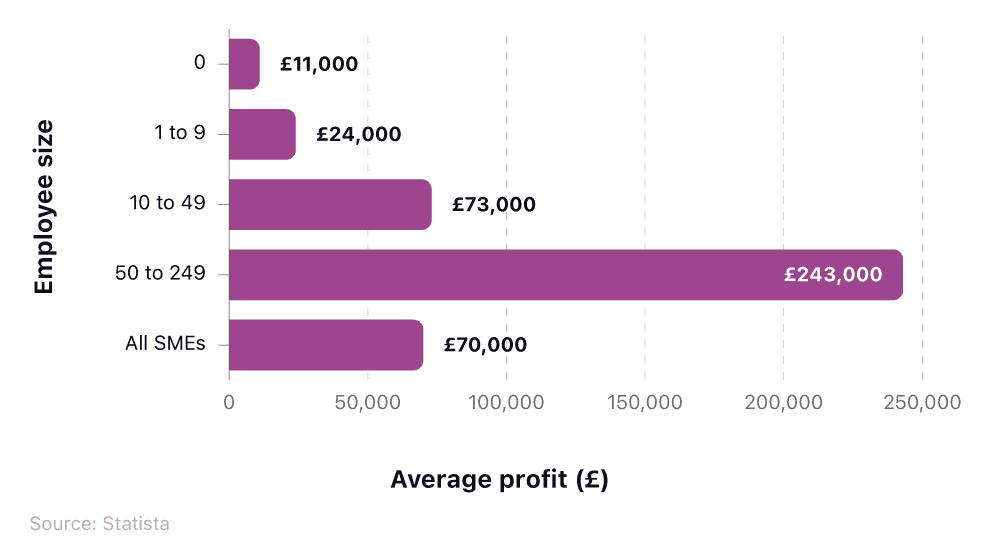
On average, those with one to nine employees usually turn over a profit that is more than double the amount for those with none.
Likewise, companies with 50 to 249 workers typically earn more than triple the average profit compared to those with 10 to 49.
What is the average profit margin for a small business in the UK?
As of Q2 2025, the average profit margin for a small business in the UK stood at 10%. This is unchanged from Q1 2025 but represents a year-on-year fall of 0.2 percentage points.
What is the average profit margin for a small business in the UK?
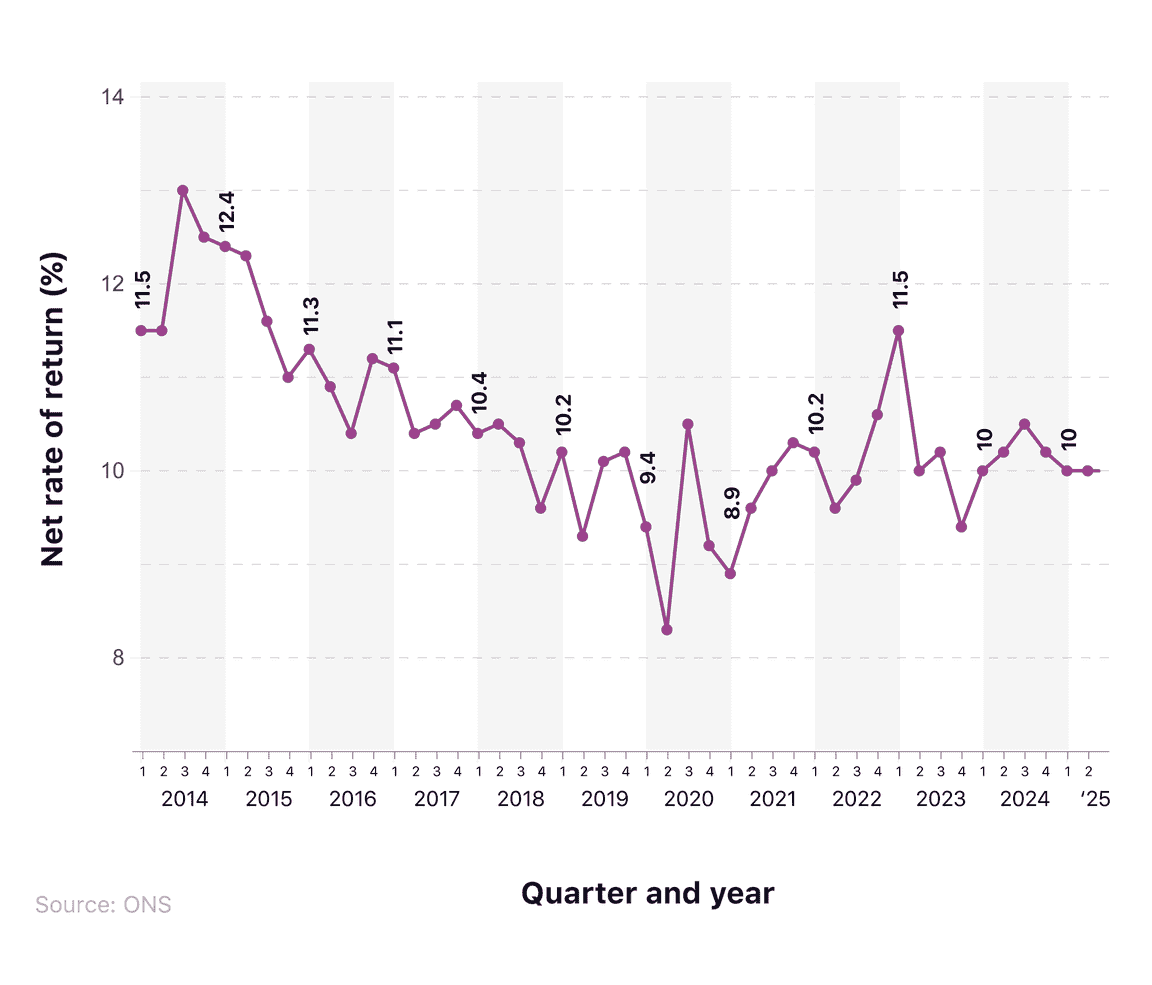
Since Q1 2014, the net rate of return percentage for UK businesses has fluctuated, peaking at 13% in Q3 2014 and falling to a low of 8.3% in Q2 2020 (during the start of the COVID-19 pandemic).
Since 2024, the rate has remained fairly steady at between 10% and 10.5%.
You can help grow your SME with a business savings account, allowing you to earn interest, plan, and build a cushion that helps support the sustainable growth of your company.
UK small business expenditure statistics
Average monthly rent for a small business in the UK
According to a study by Real Business Rescue, London has the highest average rent for retail space across all towns and cities in the UK. At £49.64 per square foot a year (or roughly £4.14 per square foot per month), this is 13p greater than second-placed Oxford.
The most and least expensive areas in the UK for average retail rental prices
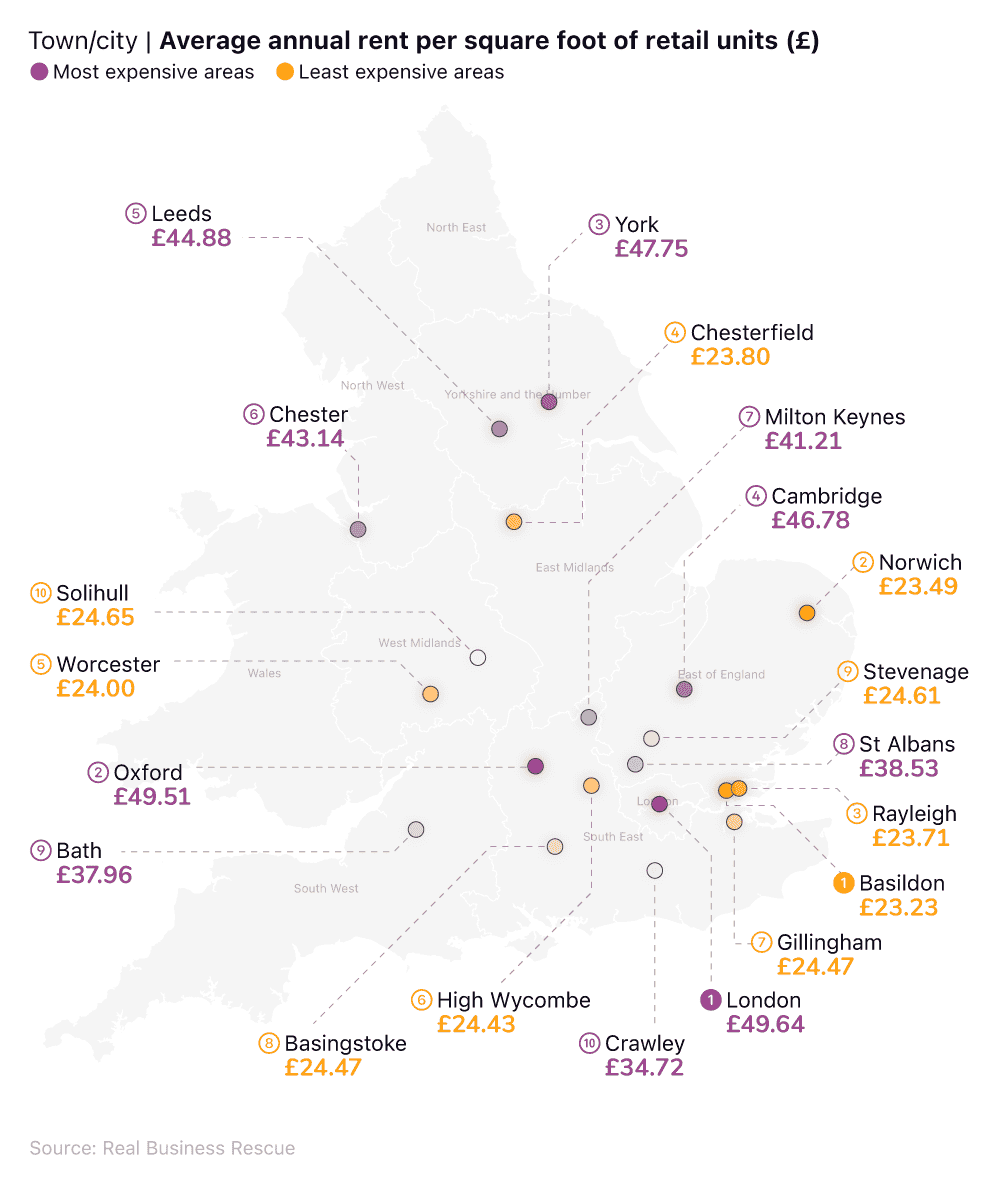
At the other end of the scale, Basildon recorded the lowest average rent for businesses from those included in the study. With typical retail rental costs of £23.23 per square foot per year (or around £1.94 per square foot per month), this makes it less than half the average cost faced by those situated in the capital.
The same can be said for Norwich, Rayleigh, and Chesterfield, which all recorded average rental costs of less than £24 per square foot per year for retail space.
Average cost of small business insurance in the UK
In 2026, the average cost of employers’ liability insurance in the UK was around £60 for a single office worker, rising to £750 for five workers.
Our latest business insurance statistics report found that more than half of UK SMEs stopped buying at least one form of business insurance cover. The most common reasons given for not having insurance were that their business was too small (47%) or they now work from home (42%).
Research by Aviva also found that 17% of SMEs potentially don’t have employers’ liability insurance (a legal requirement for firms that employ people). Despite this, 91% of surveyed businesses said they felt confident they had the right cover in place, highlighting a potential gap between perceived and actual insurance compliance.
The average energy bill for a small business in the UK
The average energy use for SMEs in the UK can vary depending on the size of the business and whether you’re referring to electricity, gas, or dual-fuel consumption.
For example, as of 2026, a micro-business (one with zero to nine employees) typically uses around 15,000 kWh of electricity and 10,000 kWh of gas a year. For the average small business (i.e., those with between 10 and 49 workers), this increases by 10,000 kWh for electricity and 15,000 kWh for gas.
Average energy consumption for UK small businesses
| Business size | Average electricity consumption | Average gas consumption |
| Micro | 15,000 kWh | 10,000 kWh |
| Small | 25,000 kWh | 25,000 kWh |
| Medium | 50,000 kWh | 45,000 kWh |
| Large | >50,000 kWh | >65,000 kWh |
Source: Data from Bionic’s guide What is the average energy consumption for different UK businesses? How much energy does an average business use?
These figures practically double once you become a medium-sized business and start employing 50 to 249 people, with average electricity consumption of 50,000 kWh and 5,000 kWh for gas.
Large corporations can be expected to use over 50,000 kWh of electricity and more than 65,000 kWh of gas per year. This is over triple the amount of electricity usage of a typical micro-business, and over six times the gas consumption.
The average cost of electricity by business size in the UK, Q4 2025
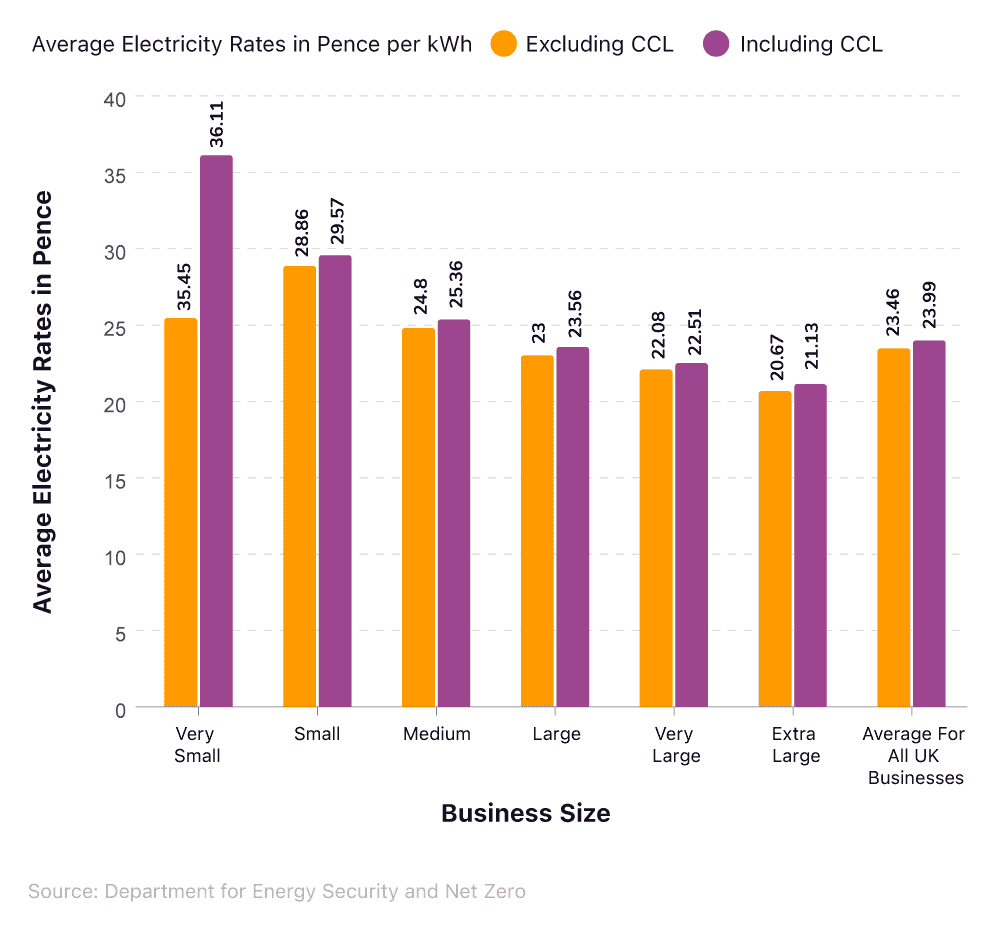
Small business statistics show that the average cost of business electricity is 23.46p per kWh in 2025, when excluding the Climate Change Levy (CCL) – a mandatory environmental tax added to commercial energy bills. When including CCL, the price rises 0.53p to 23.99 per kWh.
The average cost per kWh for business electricity decreases as business size increases, with very small businesses typically paying the most at 36.11p per kWh (including CCL). This falls by more than 10p for medium businesses (25.36p), with the lowest rates occurring for extra-large companies (21.13p).
This suggests that although larger businesses typically consume more electricity overall, they tend to benefit from lower cost per kWh rates as usage increases.
Annual business energy cost by size
Small business statistics show a correlation between business size and higher energy bills. Micro-businesses typically pay the least, with average annual costs of approximately £888 for electricity and £336 for gas, taking their total outlay to just under £1,230.
Electricity costs more than triple for small businesses, surpassing £2,880, while gas prices more than double (£875.64), taking the average annual bill past £3,700.
The average cost of energy by business size and usage in the UK
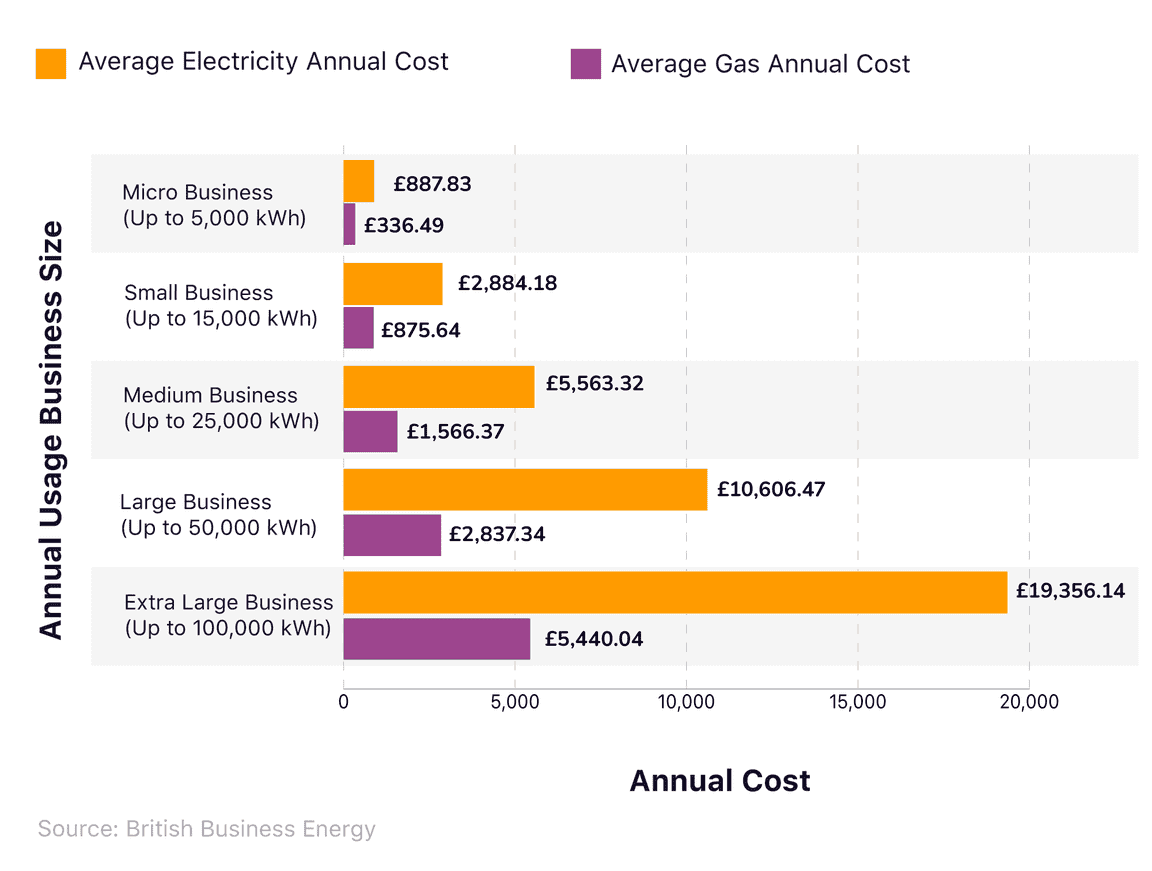
Combined annual costs surpass £13,400 for large businesses, with the typical cost of electricity alone exceeding £10,606.
Extra-large businesses face typical annual energy bills of almost £24,800, with electricity accounting for around 78% of the total cost. This means that the average annual energy bill for an extra-large company is more than 20 times greater than that of a micro-business.
Compare business gas quotes to see if you can switch and save money on your energy bills.
Proportion of total business costs for small businesses that are spent on gas bills
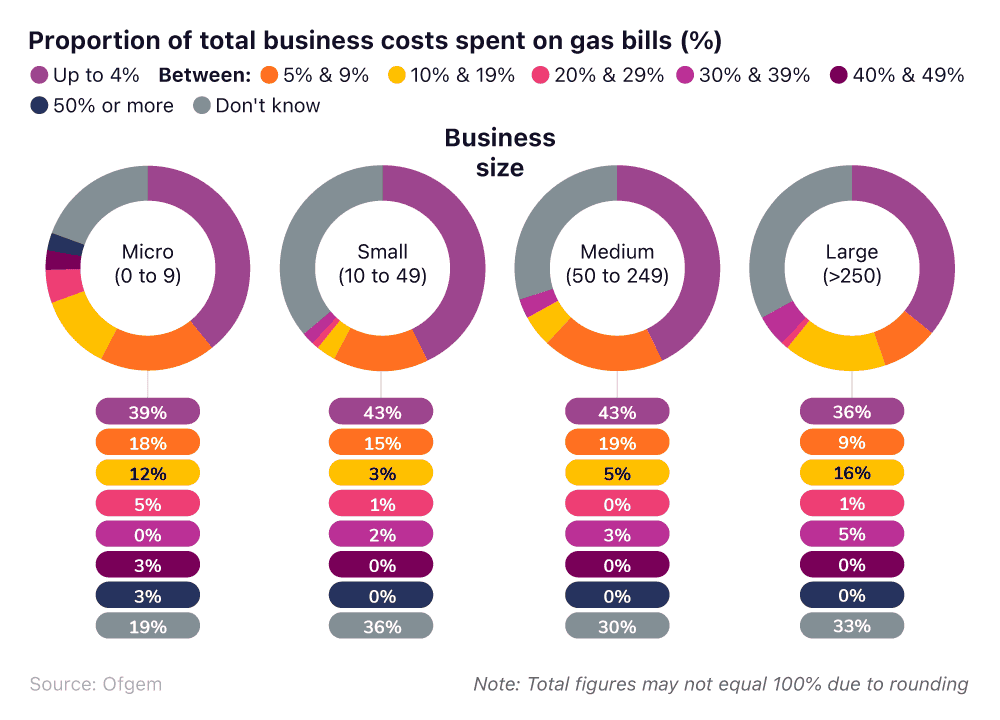
According to Ofgem, 43% of small businesses spend less than 4% of their total business costs on gas bills, with 15% facing gas costs between 5% and 9% of their overall expenditure.
In total, more than 60% of UK small businesses spent less than 20% of their total outgoings on gas consumption in 2024.
Incidentally, 36% of small business owners surveyed by Ofgem claimed not to know how much they spend on gas – the highest percentage across all business sizes.
Proportion of total business costs for small businesses that are spent on electricity bills
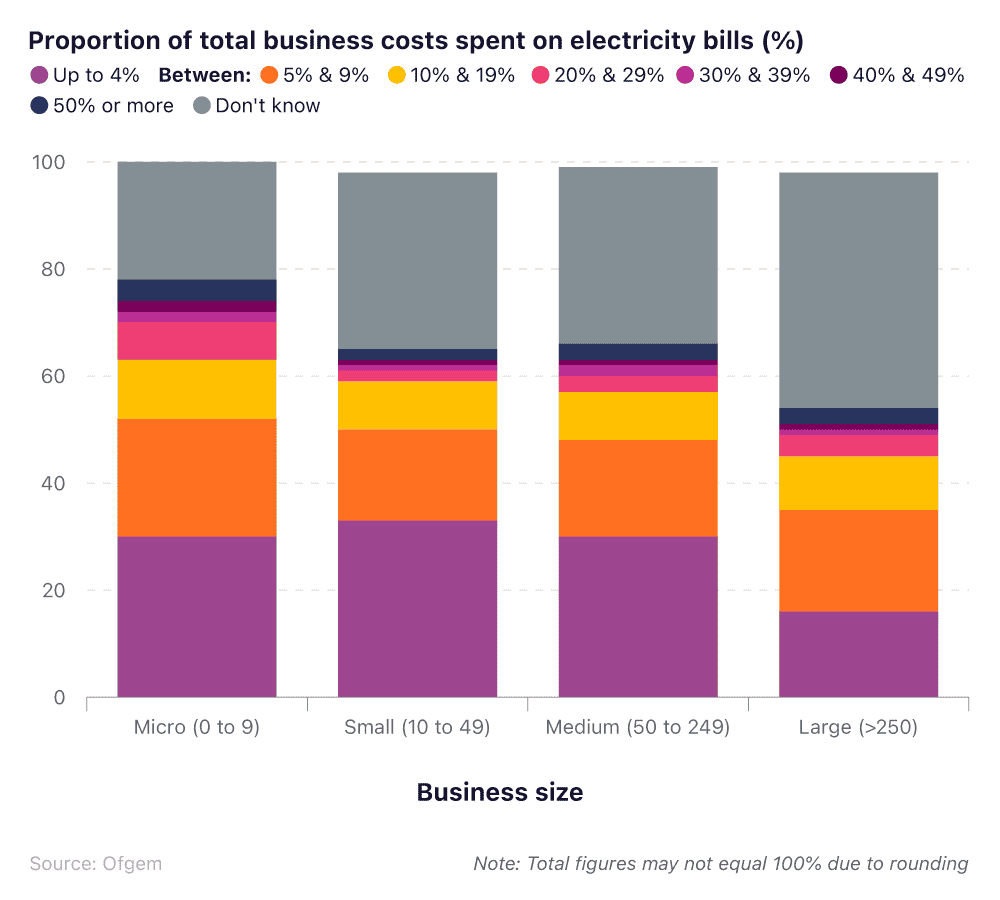
Ofgem’s 2024 Non-domestic Research Report found that a third of UK small businesses spend up to 4% of their total business costs on electricity. An identical percentage were unaware of how much electricity costs their company each year relative to their total business outgoings.
In all, 59% of small businesses surveyed by Ofgem spent less than 20% of their total business expenditure on electricity in 2024.
Compare business electricity quotes to see if you can switch to a different tariff and save money on your energy bills.
Small businesses’ experiences of the energy market (vs. other-sized companies)
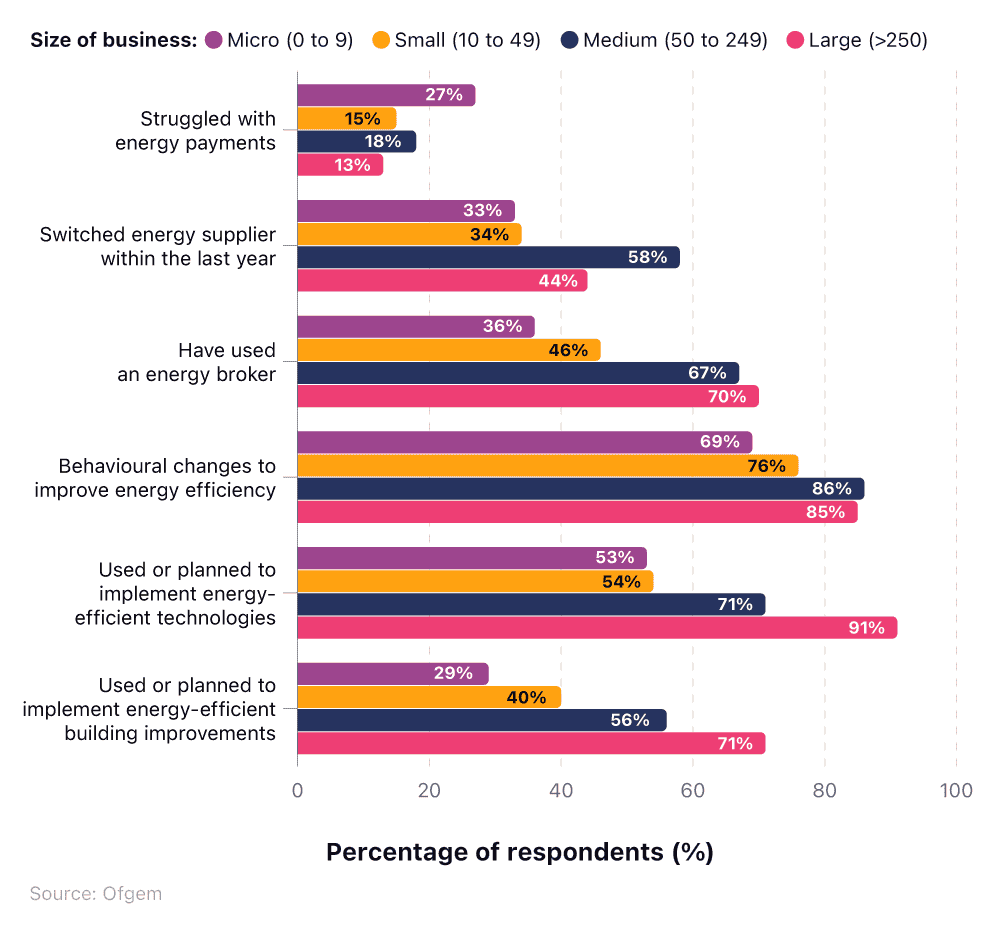
As of 2024, 15% of UK small businesses claimed to be struggling with their energy payments, compared to 27% of micro-businesses and 18% of medium-sized companies.
In addition, over a third of small businesses admitted that they had switched suppliers within the last year, with 46% using an energy broker.
Check out our guide on how finance can help SMEs lead on sustainability and develop a long-term, green business model.
Ofgem’s latest report into the UK business energy market also found that:
Smaller businesses tend to struggle more with paying their energy bills than larger corporations. This figure was around double the proportion for microenterprises compared to large businesses (27% vs. 13%).
Large companies are around twice as likely to use an energy broker as micro-businesses and almost 2.5 times more likely to make energy-efficient building improvements as part of their business energy strategy.
76% of UK small businesses have made behavioural changes within their company to improve energy efficiency, compared to 86% of medium and 85% of large corporations.
Over half of UK micro and small businesses have introduced energy-efficient technologies in a bid to reduce energy consumption and costs, contrasted with more than nine in 10 large enterprises.
A business credit card can be a great way to help save money, boost your cash flow, and unlock rewards that are tailored towards your company’s spending.
What is the average water bill for a small business in the UK?
The average water bill for a UK business ranges between £1,165.43 for a small business and up to £7,950.80 for medium or large businesses. However, this may vary depending on how much water you use, your provider, your tariff, and where you’re located in the country.
Average cost of a water bill for UK businesses by provider
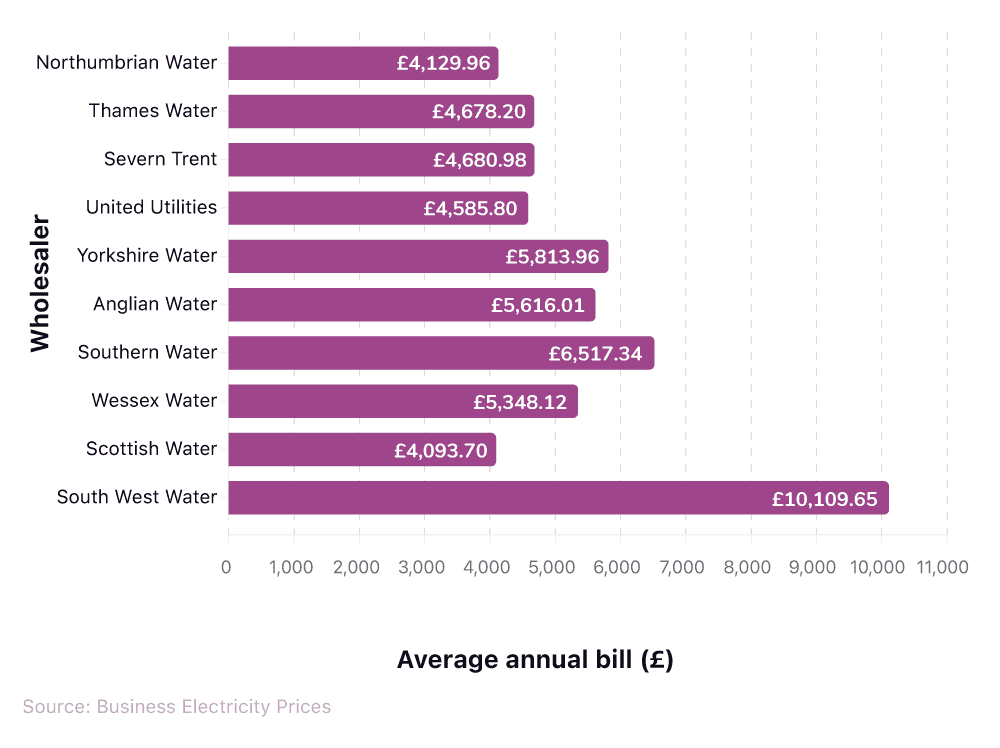
Scottish Water produced the lowest average cost of water for businesses in 2024-2025, with typical annual charges of just under £4,100. This was around 2.5 times less than companies supplied by South West Water (the most expensive area for business water rates), at £10,109.65.
Average marketing costs for a small business in the UK
The average marketing costs for a small business in the UK are largely dependent on your total revenue and how established your company is.
For example, new, up-and-coming businesses (i.e., those less than five years old) are likely to spend a greater proportion of their budget on marketing as they seek to build a name for themselves, develop their brand, and gain customer loyalty.
Spendesk estimated that these enterprises should allocate between 12% and 20% of their gross revenue on marketing efforts, compared to between 6% and 12% for more established companies.
Average marketing budget for UK businesses over time (as a percentage of total revenue)
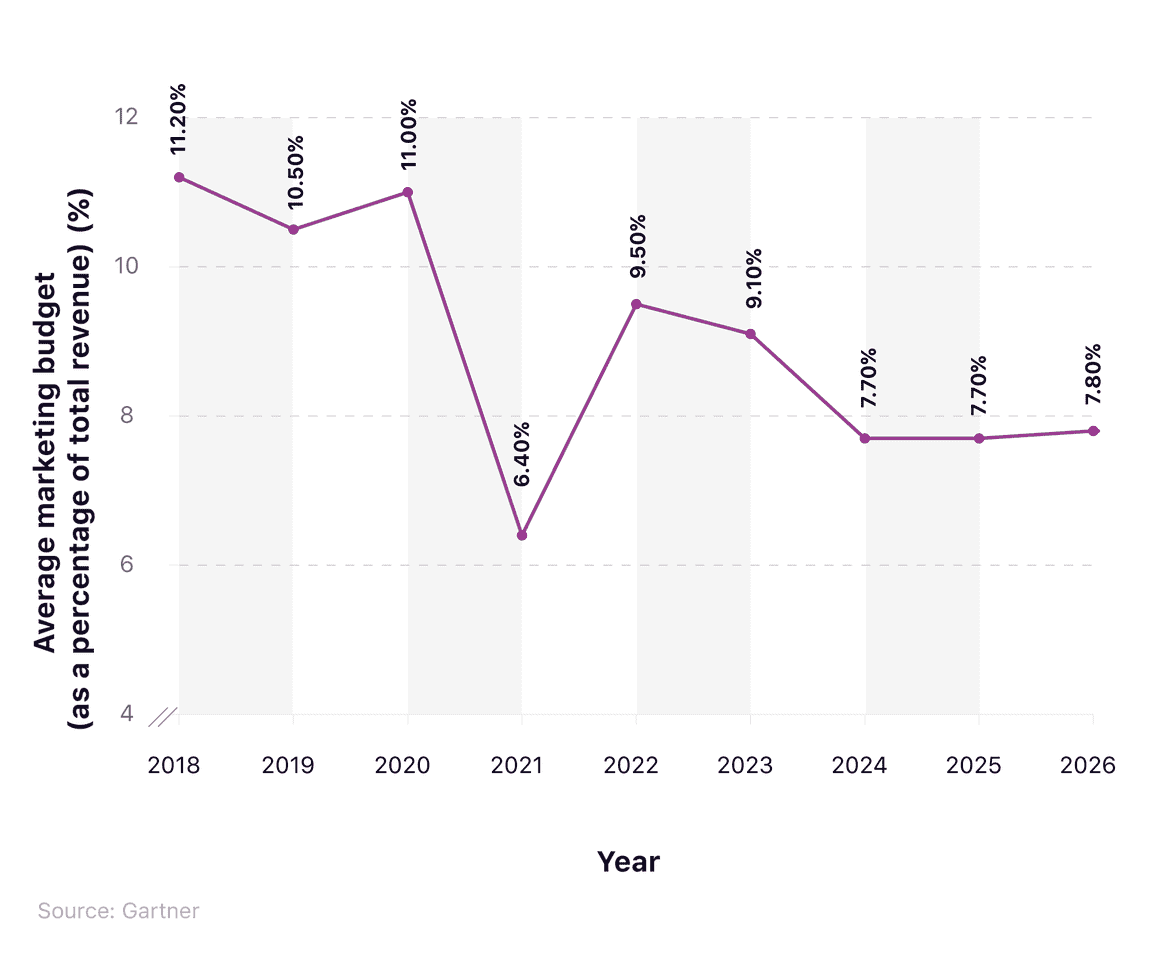
Gartner’s latest marketing report found that UK businesses spend an average of 7.8% of their total revenue on their marketing budget in 2026, up from 7.7% in 2025.
This latest figure is over three percentage points lower than the 2018 figure of 11.2%, but substantially higher than the pandemic low of 6.4% in 2021.
Did you know? 43% of UK microbusinesses use personal current accounts for business banking. As a limited company in the UK, you’re legally required to have a business bank account to manage finances, pay taxes, and issue dividends. You could also look into opening a business savings account to help keep your funds safe while earning interest.
How much do UK SMEs invest?
According to the latest small business stats from the British Business Bank, SMEs invested £12.31 billion in 2024, with just under 47% of this coming from companies with 50 to 249 employees.
Average investment by business size
| Business size | Gross Value Added (GVA) (£bn) | Median average investment (as a percentage of GVA) (%) | Total investment (approx. GVA x median) (£bn) |
| 1 to 9 | £263.41bn | 1.14% | £3.69bn |
| 10 to 49 | £199.52bn | 1.44% | £2.87bn |
| 50 to 249 | £219.56bn | 2.62% | £5.75bn |
| Total | undefined | undefined | £12.31bn |
Source: Data from the British Business Bank’s report Small Business Finance Markets 2024/25, Page 30, Table A
Details from the 2025 Small Business Finance Market Report suggest that small businesses invested an average of 1.44% in 2024 (as a percentage of their GVA), with this figure decreasing for micro-businesses (1.14%) and increasing for medium-sized companies (2.62%).
Average small business loan for UK SMEs
The latest figures indicate that the average small business loan for a UK SME is around £14,000.
Our business loans statistics report also found that the overall value of UK SME bank loans in 2024 reached £62.1 billion – marking a year-on-year rise of 4.9%.
In 2025, gross bank lending for SMEs stood at £68 billion, the second-highest figure since 2012.
The future of UK small businesses
A government report found that 67% of UK SMEs in 2024 with employees expected their employee numbers to stay the same over the next 12 months.
Expected change to the number of employees among UK SME employers
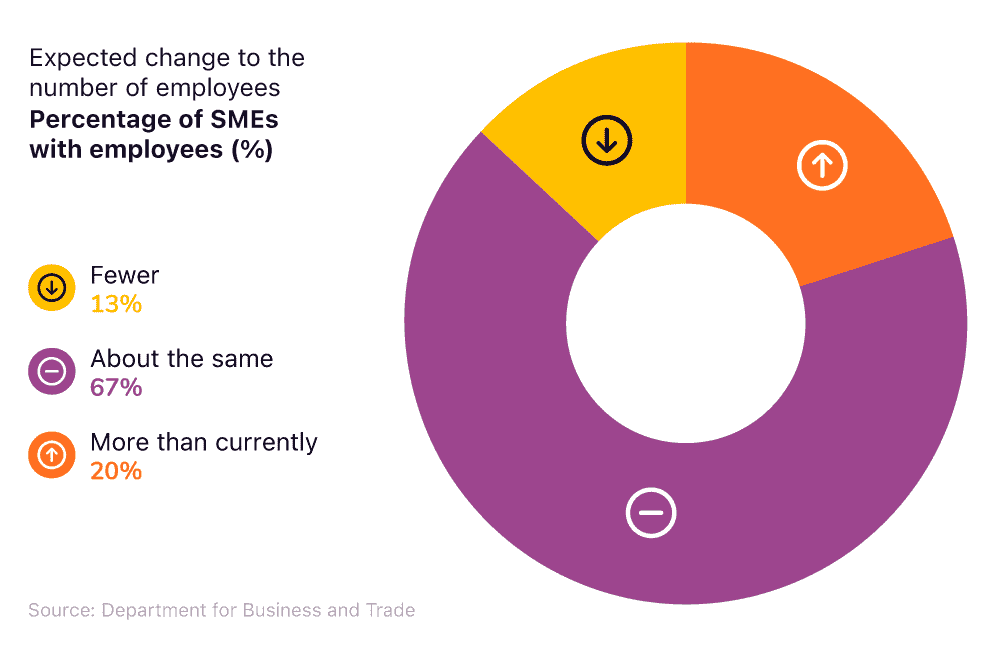
By comparison, a fifth of those surveyed by the Department for Business and Trade were expecting to employ more people in the future, with 13% anticipating staff cuts.
Expected change to the average turnover for SMEs with employees in the UK
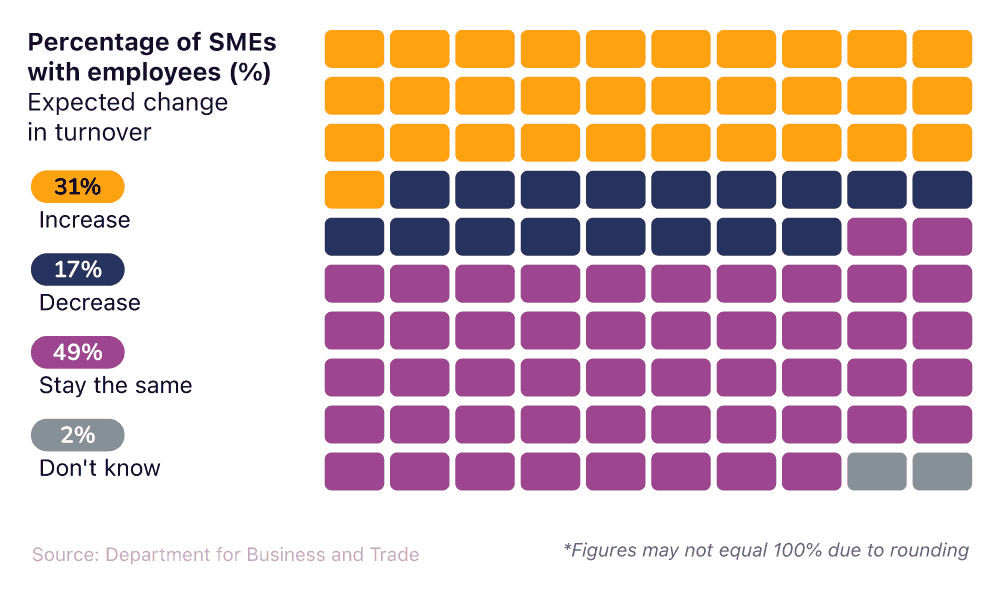
Over 30% of UK SMEs with employees expected their average turnover to increase in the year following 2024, with 17% anticipating decreases. Just under half expected their turnover to stay the same, making this the most common prediction among SME employers.
Sales growth objectives for UK SMEs with employees over the next three years in 2024
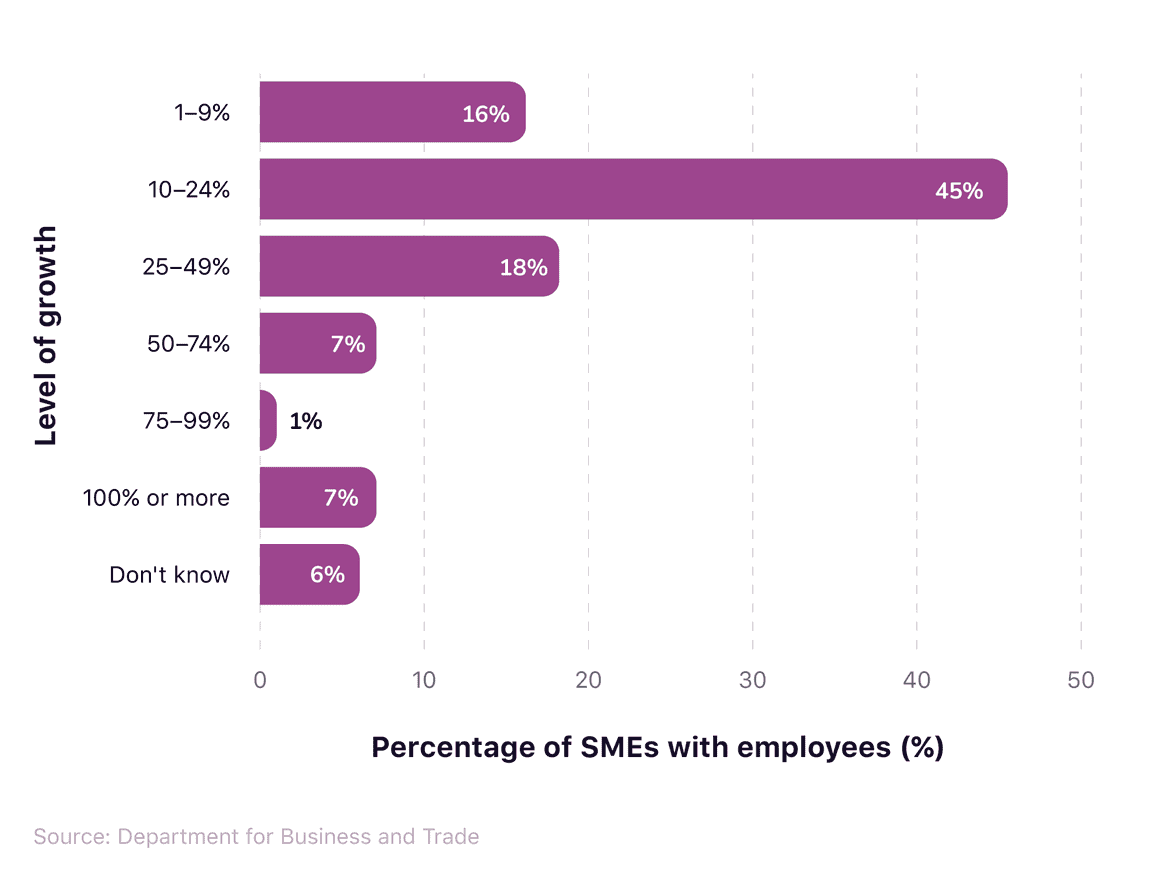
UK government data indicates that 45% of SMEs aiming to grow their business anticipate sales growth of between 10% and 24% in the three years from 2024. In total, 15% of companies anticipate increases of at least 50%, with 7% expecting their sales to either double or grow even further.
Expected use of external finance in the next three years for UK SMEs, 2024
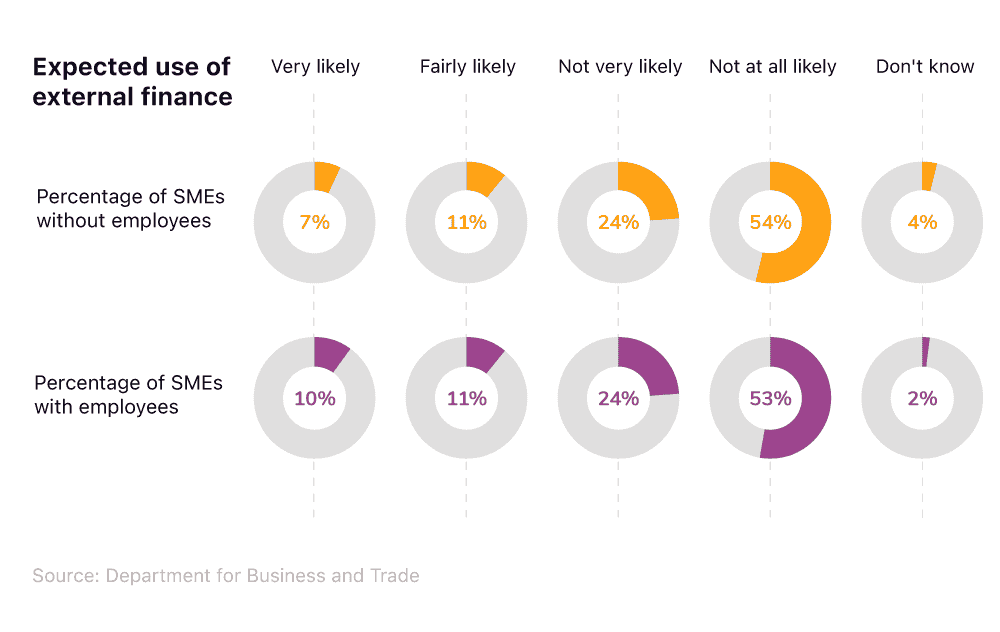
More than three-quarters (77%) of SMEs with employees do not expect to use external finance in the next three years from 2024, with this number higher still in SMEs without employees (78%).
Less than a fifth (18%) of SMEs without employees consider it likely they’ll seek external finance, with this number rising to 21% among those with employees.
Small business FAQs
A micro business has fewer than 10 employees.
A small business has between 10 and 49 employees.
A medium-sized business has between 50 and 249 employees.
Sources and methodology
https://www.statista.com/statistics/291299/average-profit-of-smes-in-the-uk-by-enterprise-size/
https://www.gemconsortium.org/report/gem-uk-20242025-national-report
https://www.gemconsortium.org/report/gem-united-kingdom-20232024-national-report-2
https://www.ons.gov.uk/economy/nationalaccounts/uksectoraccounts/timeseries/lrww/prof
https://www.realbusinessrescue.co.uk/advice-hub/uk-retail-rental-prices
https://www.money.co.uk/business/business-insurance/statistics
https://bionic.co.uk/business-energy/guides/average-energy-usage-for-businesses/
https://www.businessenergyuk.com/business-electricity/
https://www.businessenergyuk.com/
https://www.ofgem.gov.uk/sites/default/files/2025-03/Businesses
https://www.businesselectricityprices.org.uk/water-prices/
https://www.spendesk.com/blog/startup-marketing-budget/
https://www.gartner.com/en/marketing/topics/marketing-budget
https://www.nationwide.co.uk/media/news/four-in-ten-microbusinesses-shun-business-bank-accounts
New business incorporation statistics
money.co.uk conducted a study to analyse new small business statistics in the UK for the years 2024 to 2026. The analysis is based on data from Companies House, the UK's official collection of companies. Companies House maintains a public database of all registered businesses in the UK, including metrics such as incorporation date, registered address, company status, etc.
For this study, the dataset was filtered using incorporation dates to include businesses formed in 2024, 2025, and 2026.
For year-on-year (YoY) change and growth calculations, only complete calendar years (2024 and 2025) were used to ensure fair comparison.
To assign businesses to geographic regions, the ONS Postcode Directory was used to map each postcode to its corresponding UK region.
The dataset was then aggregated at both regional level to support analysis of growth trends.
The remaining months of 2026 were projected using a two-stage approach: a linear trend based on 2024 to 2025 monthly incorporation data, combined with seasonal adjustment factors derived from historical monthly averages. The final forecast was obtained by applying seasonal multipliers to the trend estimates.
Though the dataset doesn't contain specific SME metrics, over 99% UK-based businesses are SMEs, meaning SME figures can be easily inferred from the wider data.

About Joe Phelan
Joe is an experienced writer, journalist and editor. He has written for the BBC, National Geographic, and the Observer. As a business expert, his work frequently spotlights the ventures and achievements of small business owners. He writes a weekly insight article for money.co.uk, published every Tuesday.
View Joe Phelan's full biography here (opens in a new tab) or learn more about our editorial policy (opens in a new tab)