UK diversity in business statistics 2023

We’ve collated the latest diversity in business statistics on UK businesses for 2023 including; women in business, ethnic minorities and more. Here's what we found.

Today, more than ever, employers are choosing to prioritise diversity, equity, and inclusion (DEI) initiatives in the workplace. But just how diverse is the business landscape, and how has it changed over the last decade? We got investigating to bring you the latest business diversity statistics for 2023.
On this page, we’ll cover:
Women in business statistics
Women in leadership statistics
Women on boards statistics
The economic contribution of female-led businesses
UK areas with the most female founders
UK industries with the most female founders
Ethnic minorities in business statistics
Ethnic diversity in the FTSE 100
Ethnic diversity in the FTSE 250
Barriers do ethnic minority small business owners face
Women in business statistics
In recent years the number of women entrepreneurs has been on the rise – particularly since 2000.
From the number of women deciding to register their own businesses to the industries and parts of the country with the most female entrepreneurs, we’ve looked at the data to understand what female entrepreneurship looks like in the 2020s.
Want to read more general business statistics? We’ve collated the latest facts and statistics on UK businesses including; sectors, size, employment, type age, owners, location, performance and investment.
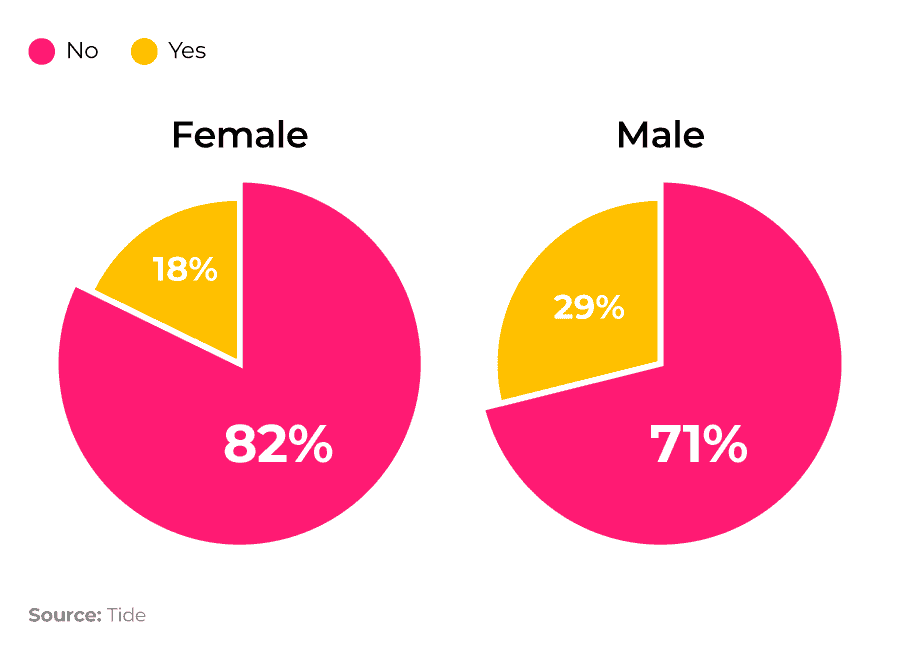
How many women have considered starting a business?
According to a survey from Tide, one in five (18%) women considered starting a business in 2021. The same question was asked to men, and over a quarter (29%) said yes - meaning for every two women who’d thought about it, three men had.
If you are thinking of starting a business, visit our hub for lots of guides, tips and information.
When you are ready you can then compare business bank accounts, business credit cards, business loans, business savings accounts and business insurance to get the best deals.
Have you ever considered starting your own business?
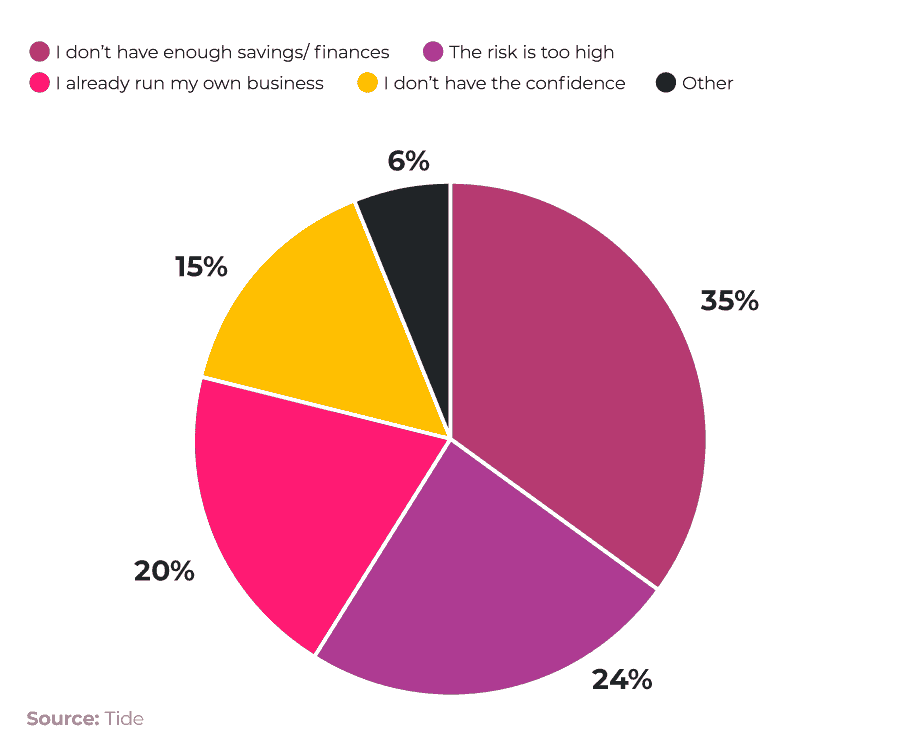
Of the women surveyed, one in five (20%) who said they had thought about running a business had taken the step to start their own business. Of those who had thought about starting their own business but hadn’t yet taken the plunge, the most common reason was concerns about savings or financial worries, while the second most common reason for women not starting a business was the risk involved.
What would prevent you from starting your own business?
How has the number of women in business changed over time?
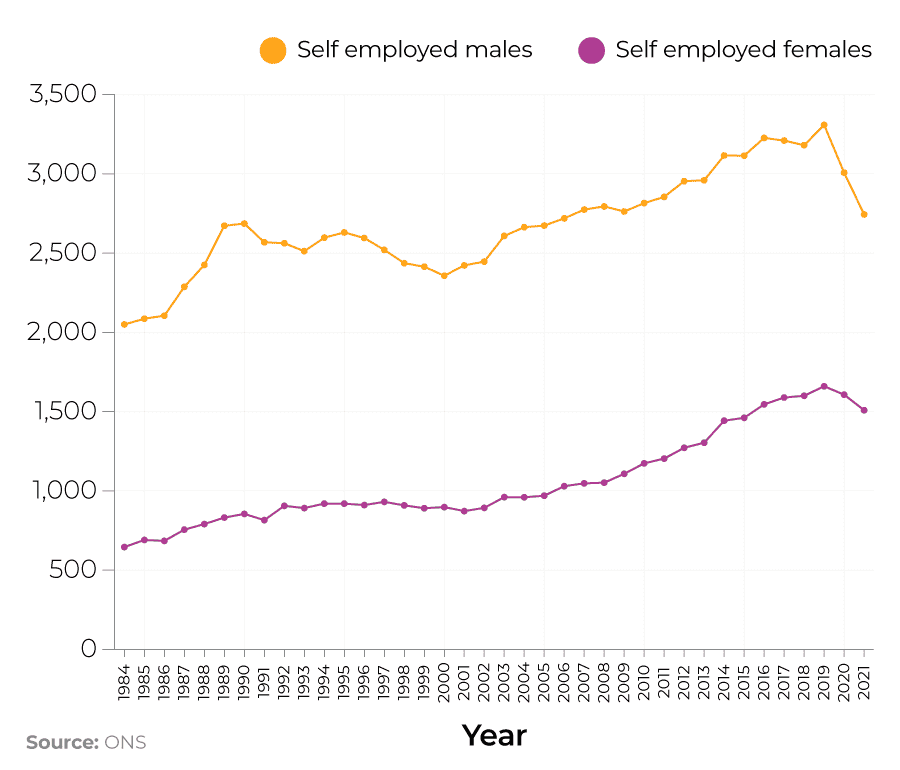
Back in 1984, there were 646,000 self-employed women in the UK. In 2020, that number has more than doubled to 1.6 million. In the same period, the number of self-employed men increased by 47%, from 2.05 million to 3.02 million.
Despite the gap slowly closing, there are still twice as many men working for themselves as women.
Self-employed male vs female business statistics, 1984-2021
How many SMEs are led by women?
In 2020, 16% of SME employers were led by women, up from 15% in 2019. This means the business was either led by one woman or by a management team with more females than males. Further to this, a quarter (24%) were “equally led”, meaning they had an equal number of men and women in their management teams.
Comparatively, 11% of SME employers had women in the minority in the management team (the same as in 2019), and 45% were entirely male-led, down from 46% in 2019.
However, not all businesswomen dream of running a large team, as some prefer to go it alone. In 2020, 21% of SMEs with no employees were led by women – 4% higher than a year earlier in 2019 and 5% higher than the percentage of women-led SMEs with employees.
Sector breakdown
Inevitably, women in business statistics vary depending on the sector. In 2020, just 6% of SME employers were led by women in the construction sector, compared to 37% in the health sector, 36% in the education sector, and 25% in the accommodation and food services.
Similarly, among businesses with no employees, women-led businesses were also most likely in the health sector (61%). Women-led businesses were less common in transport and storage (5%), construction (8%), and information and communications (11%).
Women in leadership statistics
FTSE 100 vs FTSE 250
In 2021, the representation of women in Leadership (Combined Executive Committee & Direct Reports) in the FTSE 100 had increased to 32.5%, up from 30.6% in 2020. The total number of positions also increased by just over 400 to 9,415, and the average size of the Executive Committee & Direct Report population increased to 96 roles, up from 92 in 2020.
Similarly, representation also rose in the FTSE 250, from 28.5% in 2020 to 30.7% in 2021, but not quite as much as in the FTSE 100 list. The total number of roles increased by more than 400 in 2021 to 11,848. The average size of the Executive Committee remained unchanged at 10 roles, whereas the average size of the Direct Report population increased to 56, up from 53 in 2020.
Despite this, the appointment rate continues to be in favour of men. In the FTSE 100, two-thirds of new appointments went to men in 2021 (1,604) compared to just one-third of women (945). The same goes for the FTSE 250, where a similar number of new appointments were given to men versus women–62% (1,779) to men, compared to 38% (1,107) to women.
In 2021, there were almost a thousand more women in Leadership roles in the FTSE 100 than in 2017, and more than 600 in the FTSE 250.
FTSE 100, Women in Leadership roles – 5-year overview
| FTSE 100 | 2017 | 2018 | 2019 | 2020 | 2021 |
|---|---|---|---|---|---|
| Representation of women in leadership | 25.20% | 27% | 28.60% | 30.60% | 32.50% |
| Number of women in leadership | 2084 | 2397 | 2561 | 2753 | 3062 |
| Total leadership roles | 8266 | 8882 | 8970 | 8990 | 9415 |
| Number of all-male executive committees | 7 | 5 | 6 | 4 | 3 |
| Source: FTSE Women Leaders |
FTSE 250, Women in leadership roles – 5-year overview
| FTSE 250 | 2017 | 2018 | 2019 | 2020 | 2021 |
|---|---|---|---|---|---|
| Representation of women in leadership | 24% | 24.90% | 27.90% | 28.50% | 30.70% |
| Number of women in leadership | 2984 | 2964 | 3203 | 3243 | 3638 |
| Total leadership roles | 12414 | 11923 | 11491 | 11382 | 11848 |
| Number of all-male executive committees | 47 | 45 | 38 | 24 | 13 |
| Source: FTSE Women Leaders |
Women on boards statistics
FTSE 100 vs FTSE 250
Almost half of all FTSE 100 companies had 40% or more women at the board table at the end of 2021–up from 36.2% at the beginning of the year. Of 1,058 directorships, 414 women were serving on FTSE 100 Boards.
The number of women in most senior board roles continued to increase, with 16 women Chairs and 32 women occupying the Senior Independent Director role. This means that almost half of all FTSE 100 Boards in 2021 had a woman in either the Chair or Senior Independent Director roles.
Similarly, the number of women in most senior board roles continued to increase on the FTSE 250 in 2021, with 32 women Chairs and 83 women occupying the Senior Independent Director role.
However, the number of women CEOs remains flat on both lists. In fact, in the FTSE 250, 14 companies had more women than men on their boards in 2021, a further 20 had 50%, and 92 had 40% or more. Despite this, there were still six companies on the FTSE 250 with one lone woman around the table.
FTSE 100, Women on boards – 5-year overview
| FTSE 100 | 2017 | 2018 | 2019 | 2020 | 2021 |
|---|---|---|---|---|---|
| Representation of women on boards | 27.70% | 30.20% | 32.40% | 36.20% | 39.10% |
| Number of women on boards | 294 | 317 | 341 | 374 | 414 |
| Total directorships | 1063 | 1051 | 1052 | 1032 | 1058 |
| Number of all-male executive boards | 0 | 0 | 0 | 0 | 0 |
| Source: FTSE Women Leaders |
FTSE 250, Women on boards – 5-year overview
| FTSE 250 | 2017 | 2018 | 2019 | 2020 | 2021 |
|---|---|---|---|---|---|
| Representation of women in leadership | 22.80% | 24.90% | 29.60% | 33.20% | 36.80% |
| Number of women in leadership | 453 | 497 | 582 | 652 | 724 |
| Total directorships | 1983 | 1992 | 1968 | 1962 | 1970 |
| Number of all-male executive boards | 8 | 5 | 2 | 0 | 0 |
| Source: FTSE Women Leaders |
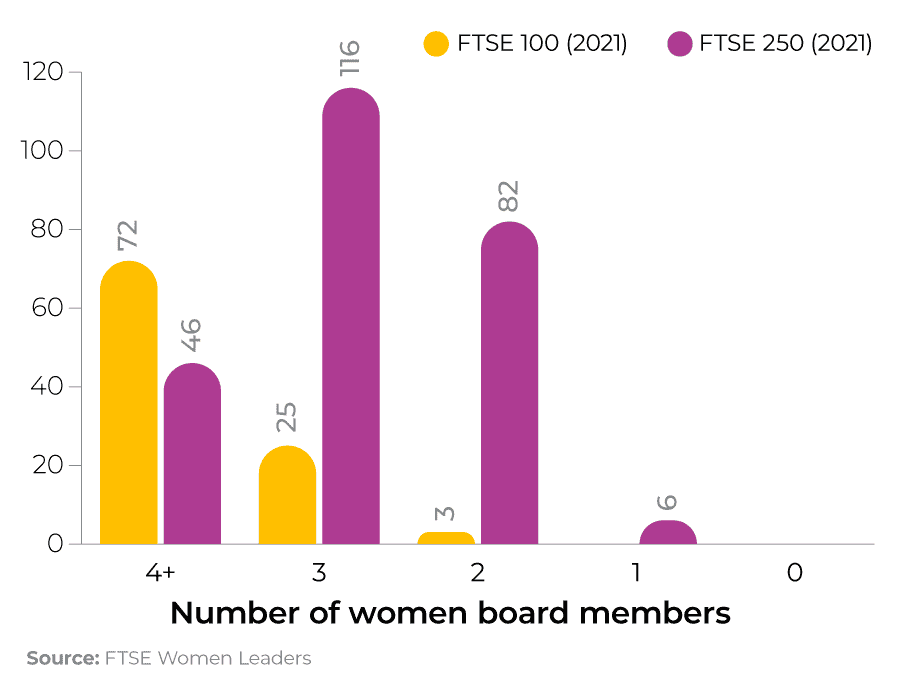
The number of companies in the FTSE 100 that have four or more women around the board table continues to grow each year. In 2021, more than 70% of FTSE 100 companies had at least four women around the board table. Only three companies had two or fewer women, compared to 42 companies with two or fewer women around the board table in 2015.
The number of companies in the FTSE 250 with four or more women around the board table also continued to grow in 2021. So much so, that it is now considered the “norm” to have three or more women on the board.
In 2011, there were 21 all-male executive boards in the FTSE 100, and 131 in the FTSE 250. The fact there are zero all-male executive boards in 2020 and 2021 shows significant progress in the fight for gender equality over the last decade.
A breakdown of the number of women board members in FTSE 100 and FTSE 250 companies (2021)
What is the economic contribution of female-led businesses?
Women-led SMEs contribute around £85 billion to the annual economic output in the UK, which is 16% of the Gross Value Added by SMEs.
More women than ever are starting new companies
According to the 2022 Rose Review, more women than ever are starting new companies, with 145,200 all-female-led incorporations in 2021, up from 56,200 in 2018. This represents an average year-on-year growth of 37.3%.
Whilst male-led companies still make up much of the landscape – 409,800 all-male-led incorporations in 2021, up from 193,400 in 2018 – women-led companies make up 20% of the total of new incorporations in 2021, up from 16% in 2018. This share has grown consistently over the last three years, despite setbacks caused by Covid-19.
Despite seeing very little progress over the past three years, the proportionate growth of female-led companies started overtaking male-led organisations in 2021. However, new companies remain almost three times as likely to be started by men than women.

Which areas in the UK have the most female founders?
Women comprise the greatest proportion of the self-employed population in Edinburgh and South East Scotland, with 39% of self-employed people being women, followed by South East England with 37%. However, these areas are still some way off from achieving gender equality when it comes to women starting their own businesses.
At the other end of the table, Northern Ireland and the West Midlands have the lowest rate of female self-employment, at 26% and 27% of self-employed women, respectively.
Female entrepreneur hotspots in the UK
| City/Region | Self-employed male | Self-employed female | % of self-employed who are female |
|---|---|---|---|
| Edinburgh and South East Scotland | 55 | 35 | 39 |
| South East | 486 | 289 | 37.3 |
| Rest of South West | 257 | 149 | 36.8 |
| East Midlands | 212 | 118 | 35.8 |
| Rest of Scotland | 76 | 41 | 34.9 |
| Rest of North East | 41 | 22 | 34.8 |
| North of Tyne Combined Authority | 35 | 19 | 34.7 |
| West of England Combined Authority | 48 | 26 | 34.7 |
| Cambridgeshire and Peterborough Combined Authority | 37 | 19 | 34.2 |
| Rest of Yorkshire and The Humber | 179 | 92 | 33.9 |
| Aberdeen City Region | 21 | 10 | 33.5 |
| Glasgow City Region | 60 | 30 | 33.3 |
| Greater London Authority | 578 | 286 | 33.1 |
| Sheffield City Region | 51 | 24 | 32.5 |
| Rest of West Midlands | 152 | 71 | 31.8 |
| Rest of North West | 143 | 67 | 31.7 |
| Rest of Wales | 54 | 25 | 31.5 |
| Rest of East of England | 294 | 133 | 31.1 |
| Liverpool City Region Combined Authority | 61 | 27 | 30.9 |
| Cardiff Capital Region | 56 | 25 | 30.9 |
| Tees Valley Combined Authority | 24 | 10 | 29.4 |
| Greater Manchester Combined Authority | 129 | 54 | 29.4 |
| Swansea Bay City Region | 36 | 15 | 28.9 |
| West Midlands Combined Authority | 122 | 45 | 27.2 |
| Northern Ireland | 99 | 35 | 26 |
| Source: ONS |
Which industries have the most female founders in the UK?
When looking at male and female self-employed businesses, there are clear differences between which industries are most popular with each gender.
Just under three-quarters (74%) of those who are self-employed in health and social work were female in 2020. This was followed by industries such as ‘households as employers’, which includes jobs like cleaners, babysitters and secretaries (69%), and other service activities, such as hairdressers and beauticians (67%).
On the other hand, construction, transport and storage, and mining and quarry were industries dominated by men, with fewer than 10% of self-employed businesses in these sectors run by women.
The UK’s industries with the most female-founders
| Industry | Self-employed male | Self-employed female | % of self-employed who are female |
|---|---|---|---|
| Health and social work | 90,000 | 256,000 | 74% |
| Households as employers | 9,000 | 20,000 | 69% |
| Other service activities | 109,000 | 219,000 | 67% |
| Prof, scientific, technical activ. | 393,000 | 228,000 | 66% |
| Education | 119,000 | 163,000 | 58% |
| Accommodation and food services | 90,000 | 79,000 | 47% |
| Admin and support services | 210,000 | 172,000 | 45% |
| Arts, entertainment and recreation | 146,000 | 110,000 | 43% |
| Real estate activities | 43,000 | 32,000 | 43% |
| Public admin and defence | 30,000 | 21,000 | 41% |
| Wholesale, retail, repair of vehicles | 268,000 | 131,000 | 33% |
| Extraterritorial organisations | 2,000 | 1,000 | 33% |
| Manufacturing | 178,000 | 55,000 | 24% |
| Information and communication | 170,000 | 54,000 | 24% |
| Financial and insurance activities | 74,000 | 24,000 | 24% |
| Agriculture, forestry and fishing | 135,000 | 36,000 | 21% |
| Water supply, sewerage, waste | 10,000 | 2,000 | 17% |
| Mining and quarrying | 10,000 | 1,000 | 9% |
| Transport and storage | 298,000 | 22,000 | 7% |
| Construction | 905,000 | 37,000 | 4% |
| Electricity, gas, air cond supply | 9,000 | 0 | 0% |
| Source: ONS |
The best and worst districts with the most opportunities for female entrepreneurs
Interested in finding out which local authority in the UK has the most opportunities for female-owned businesses, money.co.uk analysed data from the Office for National Statistics to identify the best and worst districts for female entrepreneurs in the UK.
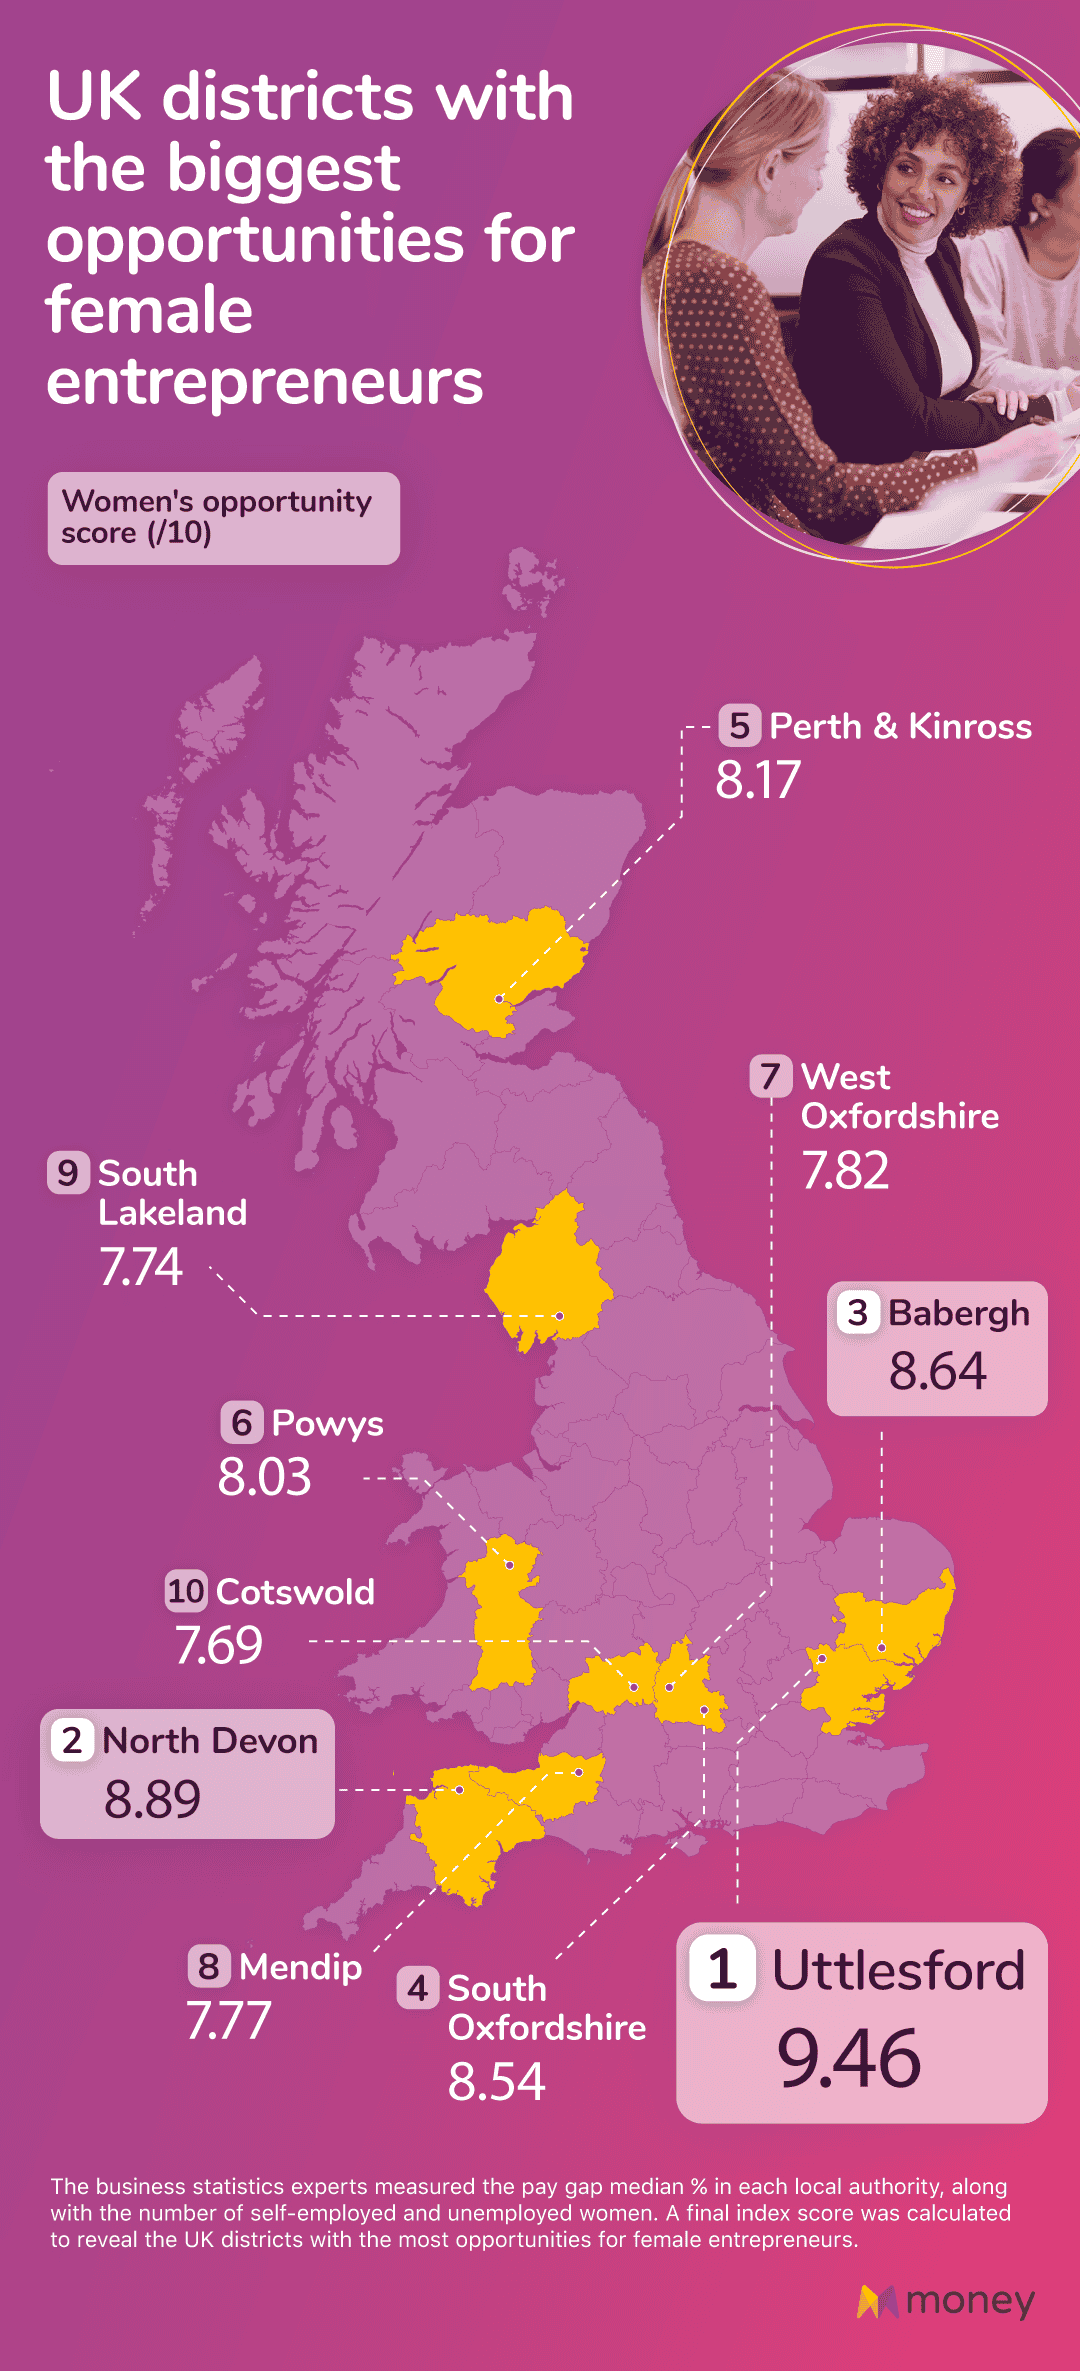
The 10 UK districts with the most opportunities for female entrepreneurs
| Local authority | Self-employment score /10 | Median pay gap score /10 | Unemployment score /10 | Final score /10 |
|---|---|---|---|---|
| Uttlesford | 9.89 | 9.24 | 9.24 | 9.46 |
| North Devon | 9.84 | 8.88 | 7.96 | 8.89 |
| Babergh | 7.65 | 9.9 | 8.37 | 8.64 |
| South Oxfordshire | 6.88 | 9.65 | 9.09 | 8.54 |
| Perth and Kinross | 7.29 | 8.58 | 8.63 | 8.17 |
| Powys | 9.23 | 7.4 | 7.45 | 8.03 |
| West Oxfordshire | 9.38 | 5.16 | 8.93 | 7.82 |
| Mendip | 8.92 | 8.73 | 5.67 | 7.77 |
| South Lakeland | 4.89 | 8.32 | 10 | 7.74 |
| Cotswold | 9.54 | 4.14 | 9.39 | 7.69 |
| Source: money.co.uk* |
At the top of the UK rankings is Uttlesford in Essex. The local authority rated highly in all three categories; self-employment (9.89/10), pay gap (9.24 out of 10) and unemployment (9.24 out of 10), with fewer than 1% of women categorised as unemployed (0.91%). This results in an overall score of 9.46 out of 10.
North Devon places second with a final rating of 8.89 out of 10. More than 12.7% of women in ‘England’s Adventure Coast’ are self-employed (9.84/10), while the locality also achieves strong scores in the pay gap (8.88 out of 10) and unemployment (7.96 out of 10) categories.
Completing the top three is Babergh, with an overall score of 8.64 out of 10. The Suffolk district achieved its highest rating in the pay gap category (9.90 out of 10), with women earning 10% more than men on average. The district’s performance in unemployment (8.37 out of 10) and self-employment (7.65 out of 10) dipped slightly but were still very high overall.
In fifth is Perth & Kinross, the best performing Scottish local authority in the study. With a final score of 8.17 out of 10, the local authority scored highest in unemployment (8.63 out of 10) and pay gap (8.58/10), while still rating respectably in self-employment (7.29 out of 10).
The five most challenging districts for female business owners in the UK
| Local authority | Self-employment score /10 | Median pay gap score /10 | Unemployment score /10 | Final score /10 |
|---|---|---|---|---|
| Doncaster | 0.05 | 1.54 | 2.05 | 1.21 |
| North-East Lincolnshire | 1.02 | 0.26 | 3.22 | 1.5 |
| South Tyneside | 1.32 | 2.15 | 1.43 | 1.63 |
| Wolverhampton | 0.91 | 3.88 | 0.21 | 1.67 |
| Newcastle Upon Tyne | 1.37 | 1.48 | 2.2 | 1.68 |
| Source: money.co.uk* |
Most of the UK’s most demanding local authorities for female entrepreneurs are in Northern England.
Doncaster is the most challenging, with a final score of 1.21 out of 10. Self-employment (0.05 out of 10) is one of the poorest in the entire study, while the pay gap (1.54 out of 10) and unemployment (2.05 out of 10) are also towards the bottom of the scale.
The second most demanding UK district for women-owned businesses is North-east Lincolnshire, with an overall rating of 1.50 out of 10. South Tyneside is third with an average rating of 1.63 out of 10.
Newcastle Upon Tyne (1.68 out of 10) is in fifth, and is the third local authority from North-East of England in the bottom five.
Ethnic minorities in business statistics
Ethnic minority SME employers
In 2020, 6% of SME employers were minority ethnic group-led – a statistic that has seen no significant change since 2015. Of these businesses, business owners are most likely to be of Indian origin (28%) and own a micro business. Black Africans are the least likely ethnicity to own a minority ethnic group-led SMEs, taking up just 4% of the total.
A breakdown of the ethnicities of business leaders for minority ethnic group-led SME employers (2020)
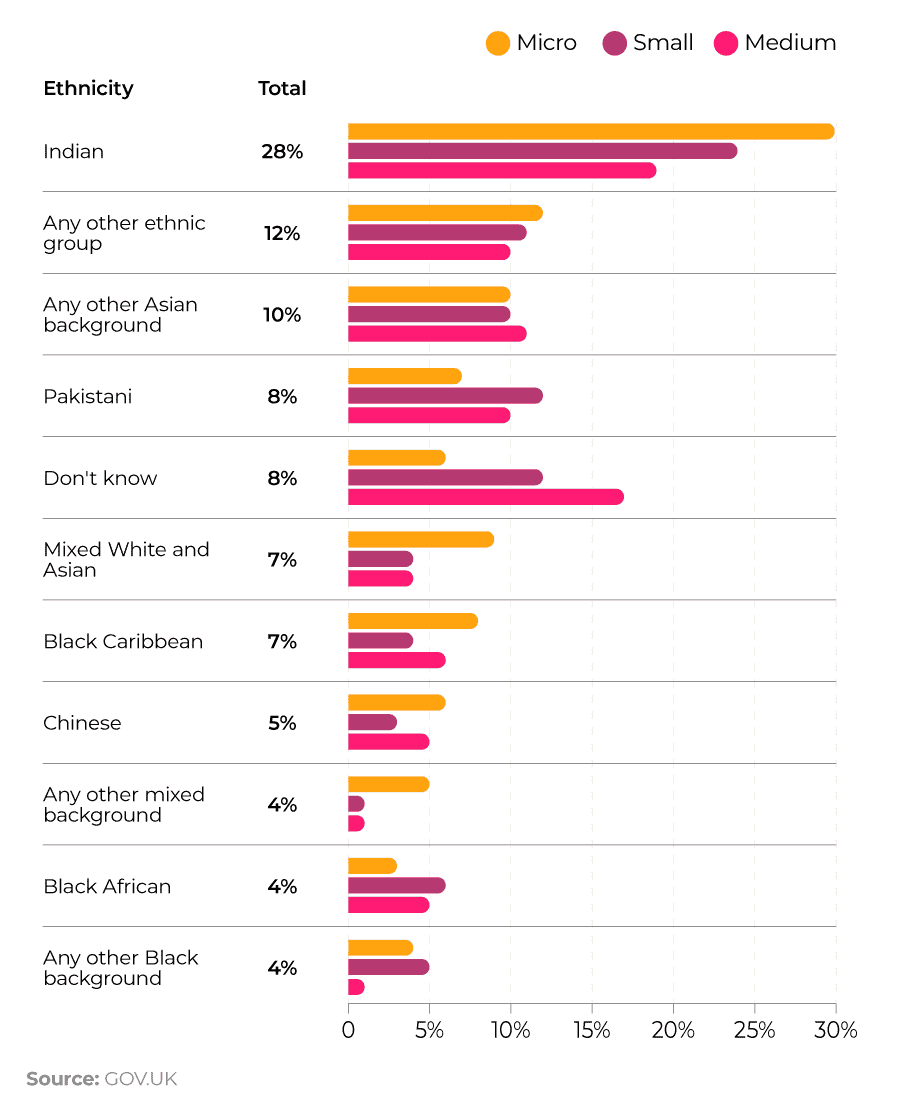
Minority ethnic group-led businesses are most likely to be in the information and communication sector (9%), as well as the accommodation and food sector (7%). On the other hand, they are less likely to have business in the primary (0%) or education (1%) sectors.
Ethnic minority SMEs with no employees (self-employed)
Similarly to minority ethnic group-led business employers, companies with no employees also made up 6% of SMEs in 2020. Of these businesses, business owners are most likely to identify as “any other ethnic group”, taking up a quarter of all SMEs.
A breakdown of the ethnicities of business leaders for minority ethnic group-led SMEs with no employees (2020)
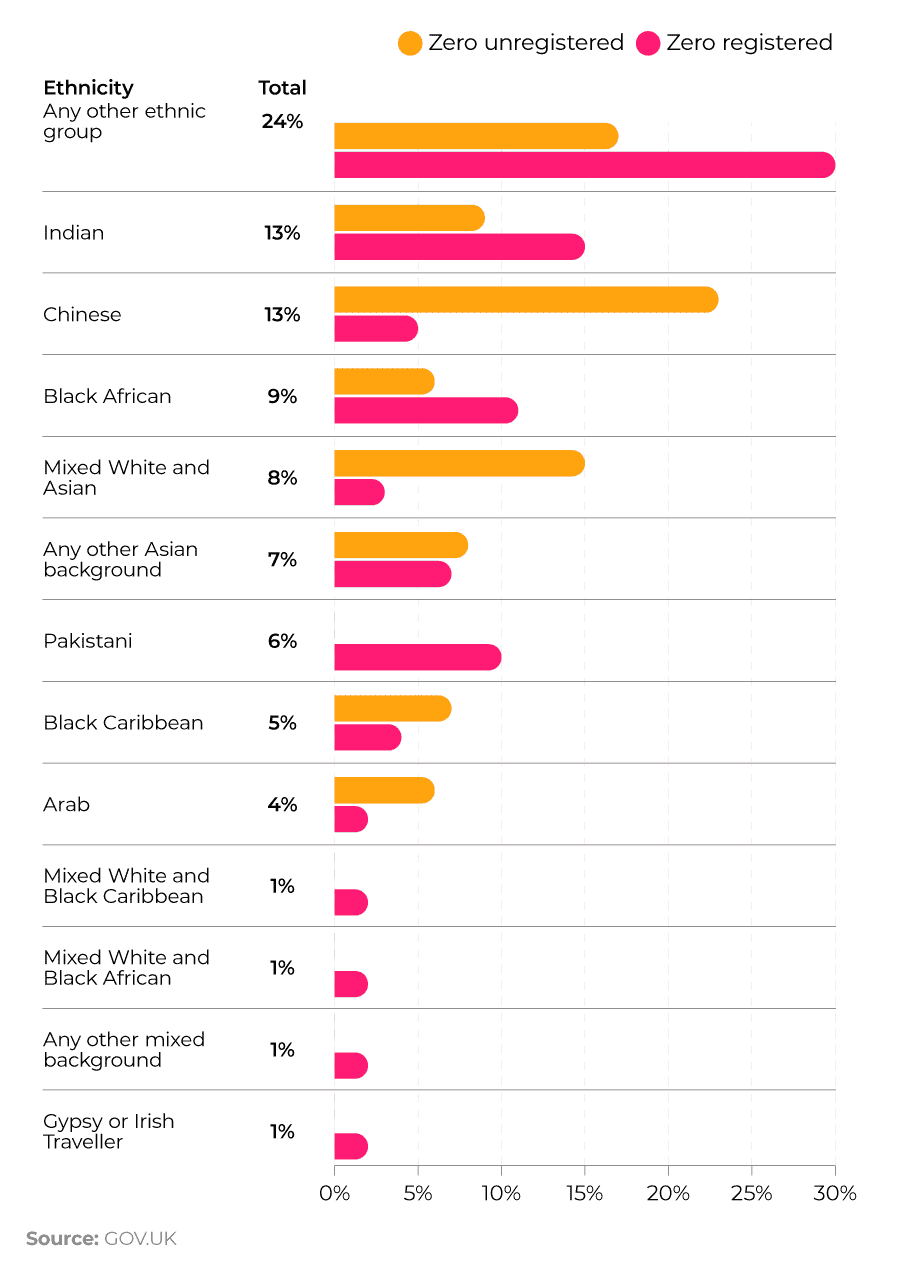
Minority ethnic group-led SMEs without employees were most likely to be in the information and communications and health sectors (both 9%) and the wholesale and retail sectors (both 8%). They were least likely to be in the primary sectors, including agriculture, forestry, fishing and mining (1%).
Where are minority ethnic group-led SMEs most common in the UK?
In 2020, ethnic minority businesses were most common in England, with 6% of SMEs being based there, compared to 2% in Scotland, Wales, and Northern Ireland.
Regionally, ethnic minority businesses are most common in London (16%) in 2020. This is likely due to London being home to a large proportion of the UK’s ethnic minority population. In fact, almost half (46%) of Black entrepreneurs and 33% of Asian and Other Ethnic Minority entrepreneurs were found to be in Greater London, compared to 11% of White entrepreneurs.
Comparatively, ethnic minority businesses are least likely to be in the North East and South West, both taking up 1% of businesses.
Ethnic diversity in the FTSE 100
There were 1,056 director positions in the FTSE 100 in 2021, with 164 seats held by a director from a minority ethnic group. This accounts for 16% of all positions and represents a 32% increase from 2020 director positions when there were 124 positions in the FTSE 100 held by a director from a minority ethnic group.
Of these 164 seats, three people from ethnic minorities held the position of Chair, six were CEOs, nine were CFOs, four were executive directors, and the other positions were non-executive directors.
59 of the 155 minority ethnic directors in the FTSE 100 were UK citizens (38%). British minority ethnic directors held 66 director positions out of the 1,056 total directors in the FTSE 100. This represents 5.6% of all positions on the list.
These numbers demonstrate that the ethnic diversity in the FTSE 100 director positions is increasing, but there is still some way to go until equality is reached.
A breakdown of the number of directors from minority ethnic groups in the FTSE 100 (2020-2021)
| 2021 | 2020 | |
|---|---|---|
| Total number of directors | 1,056 | 998 |
| Number of minority ethnic directors | 155 | 118 |
| Number of minority ethnic directorships | 164 | 124 |
| % of directorships held by minority ethnic directors | 16% | 12% |
| Source: EY |
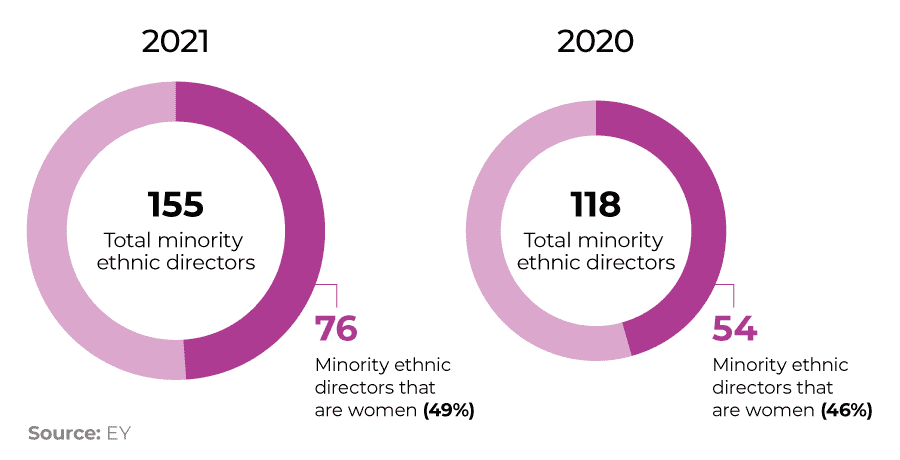
Of all Board positions held by directors from a minority ethnic group across the FTSE 100, 76 are held by women, comprising 49% of minority ethnic directors. In 2020, across the FTSE 100, 54 directorships were held by women, comprising 46% of minority ethnic director positions in the FTSE 100.
A breakdown of the number of minority ethnic female directors in the FTSE 100 (2020-2021)
Ethnic diversity in the FTSE 250
In the FTSE 250, there are a total of 1,849 director positions, with 178 (10%) held by a director from a minority ethnic group. Of these 178 seats, five people from a minority ethnic group held the position of Chair, 16 were CEOs, 13 were CFOs, and the other positions were non-executive directors.
76 of the 169 directors from a minority ethnic group in the FTSE 250 were UK citizens (45%). British minority ethnic group directors held 82 FTSE 250 director positions out of the 1,849 total director positions available in the FTSE 250 (4.4%).
A breakdown of the number of minority ethnic directors in the FTSE 250 (2021)

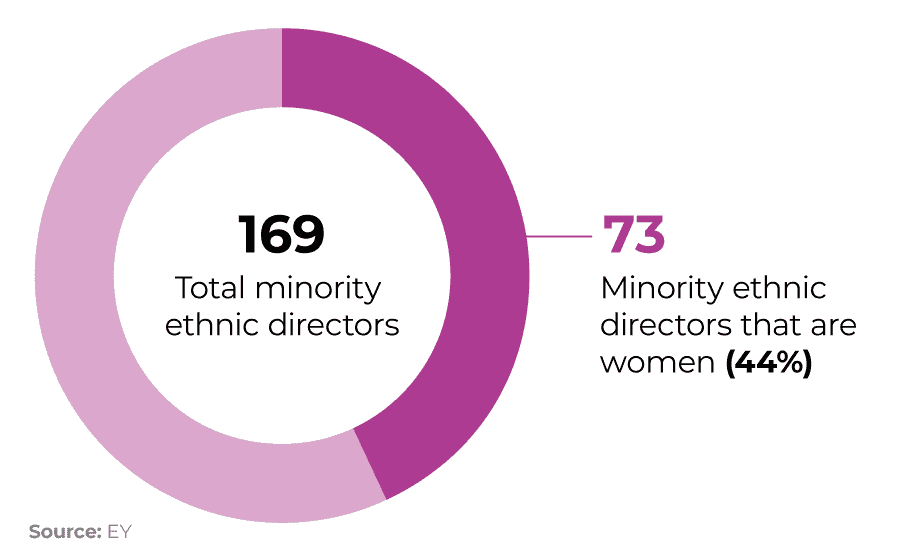
Of all Board positions held by minority ethnic directors, across the FTSE 250 73 (44%) were held by women.
A breakdown of the number of minority ethnic female directors in the FTSE 250 (2021)
Ethnic minorities in the UK are more entrepreneurial
Ethnic minorities in the UK are consistently more entrepreneurial than the White population. For example, among those thinking about going into business, the rate for ethnic minority groups is around twice that of the White population; the difference is significantly higher when comparing the Black community (23%) and the White population (7%).
The highest entrepreneurial activity rate – which measures involvement in setting up a new venture or running a young one under 42 months – was in the South East, East of England, and London.
In contrast, the three regions with the lowest levels of enterprise activity were the East Midlands, Yorkshire and Humber, and the North East. These regions had below-average non-White enterprise activity, especially the North East’s Black community.
What barriers do ethnic minority small business owners face?
Ethnic minority entrepreneurs, particularly Black entrepreneurs, continue to face multiple barriers to achieving their full potential, including discrimination throughout the entrepreneurial journey, restricting their access to external finance, wider markets, business support and other resources needed to succeed.
In a 2020 survey, 58% of aspiring Indian entrepreneurs stopped developing their business idea because of difficulties getting finance. The same goes for nearly half (42%) of aspiring Asian and Other Ethnic Minority entrepreneurs, 40% of Other White, and 39% of Black aspiring entrepreneurs, compared to a quarter (25%) of White British aspiring entrepreneurs. Stopping due to finance was most common among those from an Indian background.
This is backed up by statistics of closed businesses of ethnic minority groups, where one in five Black ex-business owners closed their business due to difficulties getting finance. This figure was around one in 20 for Asian and Other Ethnic Minority and White ex-business owners. Research has shown that Black-run businesses are more than four times more likely to be denied a business loan outright than White-run businesses; however, this is said to be primarily due to businesses’ credit characteristics and not discrimination.
The feeling of discrimination among ethnic minority business owners is also emphasised in a 2021 study of aspiring and established Black entrepreneurs, where more than half (53%) of respondents reported experiencing racism or discrimination, and 84% perceived racism as a potential barrier to their entrepreneurial efforts.
Read more small business statistics and facts on growth, profits, sectors, business failure and more. You can also check out our UK business loans statistics page for all the latest data on business borrowing in the UK.
Visit our business hub to find all our best deals on business finance products and guides.
More like diversity in business statistics
Whether you want to start a business or you're already running one, our business finance team have written a whole range of guides to help with managing your business' money.

UK Business Statistics 2025 - Business Facts and Stats Report
The latest UK business statistics for 2025, covering topics including revenue, creation, lending, and UK business statistics by industry, region, and size.
Read More
50+ UK Business Insurance Statistics 2024
What’s the average cost of UK business insurance? We’ve collated over 50 UK business insurance statistics for 2024, covering average costs and claims data.
Read More
How to get funding for a new business idea
Discover seven steps you need to follow to secure funding for your startup, from testing your idea to picking the right finance option.
Where yo look for the money you need
How to register a business?
Here’s everything you need to know to make sure your side hustle is legitimate including the difference between being a sole trader and a limited partnership, which might be right for you, and the deadlines and paperwork you need to consider
What you need to get ready now
Methodology and sources
https://researchbriefings.files.parliament.uk/documents/SN06152/SN06152.pdf
https://www.cranfield.ac.uk/-/media/files/female-ftse-report-2021.ashx
*Methodology:
Money.co.uk set out to discover which UK local authority had the most opportunities for female-owned businesses. Here’s how we gathered the data:
NOMIS (a data service provided by ONS) was used to measure the number of female business owners in each district. By combining these counts with female population statistics from ONS, the percentage of self-employed women in each local authority was calculated.
East, north and south Dorset were combined to form ‘Dorset’. Similarly; ‘Bournemouth, Christchurch and Poole’ were measured as a single district.
The experts collected the number of unemployed women from ONS (data released 19/07/2022), and compared it to the total female population to calculate the % of unemployment.
Gender pay gap median % figures were also collected from ONS (2021).
The experts applied the PERCENTRANK formula across all three variables, and were able to determine an overall rating for each local authority.
The pay gap and unemployment ratings were inverted - so a smaller pay gap and lower unemployment rate score higher.
Some local authorities were excluded due to lack of data.
Additionally, Northern Ireland was excluded as data was only available for Belfast.

About Joe Phelan
Joe is an experienced writer, journalist and editor. He has written for the BBC, National Geographic, and the Observer. As a business expert, his work frequently spotlights the ventures and achievements of small business owners. He writes a weekly insight article for money.co.uk, published every Tuesday.